
Page 278 - Laboratory Manual in Physical Geology
P. 278
Step 1 Step 4 Vertical Exaggeration
On most topographic profiles, the
A vertical scale is exaggerated
(stretched) to make landscape
features more obvious. One must
calculate how much the vertical
100 scale (V) has been exaggerated in
comparison to the horizontal scale
A´ (H).
200 The horizontal scale is the map’s
scale. This map has an H ratio
0 .5 1 kilometer scale of 1:24,000, which means
that 1 inch on the map equals
0 1 4 / 1 2 / 1 mile 24,000 inches of real elevation. It is
1:24,000 the same as an H fractional scale
of 1/24,000.
Step 2
On the vertical scale of this
topographic profile, one inch
A equals 120 feet or 1440 inches
(120 feet x 12 inches/foot). Since
one inch on the vertical scale
equals 1440 inches of real
elevation, the topographic profile
has a V ratio scale of 1:1440 and a
A´ V fractional scale of 1/1440.
The vertical exaggeration of this
topographic profile is calculated by
either method below:
Method 1: Divide the horizontal
ratio scale by the vertical ratio
scale.
Step 3 H ratio
scale = 1:24,000 = 24,000 =
220 V ratio 1:1440 1440 16.7
Topographic Profile A–A´ scale
200
A´ Method 2: Divide the vertical
180
Elevations (feet) 160 Stream fractional
fractional scale by the horizontal
fractional scale.
140
V
120
1/1440
100
H
1440
80 scale = 1/24,000 = 24,000 = 16.7
A fractional
60 scale
40
Paper strip with elevations noted beside tick marks.
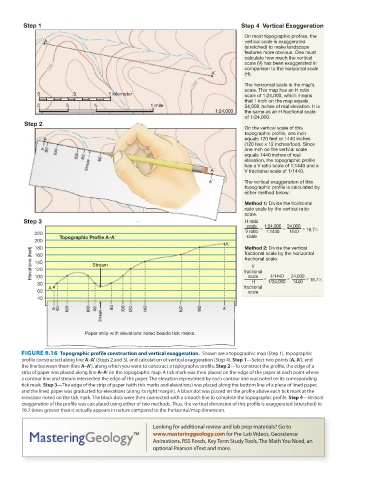
FIGURE 9.16 Topographic profile construction and vertical exaggeration. Shown are a topographic map (Step 1), topographic
profile constructed along line A–A’ (Steps 2 and 3), and calculation of vertical exaggeration (Step 4). Step 1 —Select two points ( A, A’ ), and
the line between them (line A–A’ ), along which you want to construct a topographic profile. Step 2 —To construct the profile, the edge of a
strip of paper was placed along line A–A’ on the topographic map. A tick mark was then placed on the edge of the paper at each point where
a contour line and stream intersected the edge of the paper. The elevation represented by each contour line was noted on its corresponding
tick mark. Step 3 —The edge of the strip of paper (with tick marks and elevations) was placed along the bottom line of a piece of lined paper,
and the lined paper was graduated for elevations (along its right margin). A black dot was placed on the profile above each tick mark at the
elevation noted on the tick mark. The black dots were then connected with a smooth line to complete the topographic profile. Step 4 — Vertical
exaggeration of the profile was calculated using either of two methods. Thus, the vertical dimension of this profile is exaggerated (stretched) to
16.7 times greater than it actually appears in nature compared to the horizontal/map dimension.
Looking for additional review and lab prep materials? Go to
www.masteringgeology.com for Pre-Lab Videos, Geoscience
Animations, RSS Feeds, Key Term Study Tools, The Math You Need, an
optional Pearson eText and more.