
Page 277 - Laboratory Manual in Physical Geology
P. 277
280 290 300 300 Repeat 280 290 300 300 290 No repeat
290
300 300
Repeat 300 310 320 330
290 280 Repeat
300 290 300
290 280 290
300 310 320 330
300 300
290
290
280
280
Top of hill Side of hill
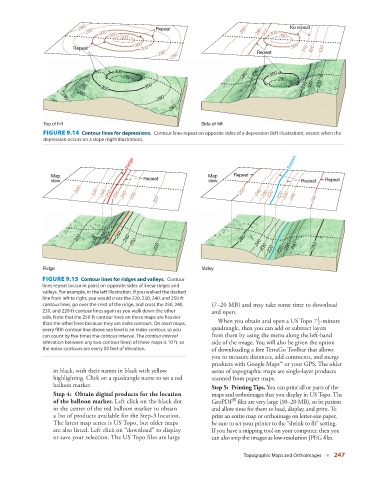
FIGURE 9.14 Contour lines for depressions. Contour lines repeat on opposite sides of a depression (left illustration), except when the
depression occurs on a slope (right illustration).
Ridge Stream
Map Map Repeat
view Repeat view Repeat Repeat
220 230 240 250 250 240 230 220 250 240 230 220 220 230 240 250
220 230 240 250 250 240 230 250
220 240 230 220 220 230 240 250
Ridge Valley
FIGURE 9.15 Contour lines for ridges and valleys. Contour
lines repeat (occur in pairs) on opposite sides of linear ridges and
valleys. For example, in the left illustration, if you walked the dashed
line from left to right, you would cross the 220, 230, 240, and 250-ft
contour lines, go over the crest of the ridge, and cross the 250, 240, (7–20 MB) and may take some time to download
230, and 220-ft contour lines again as you walk down the other and open.
side. Note that the 250-ft contour lines on these maps are heavier 1
than the other lines because they are index contours . On most maps, When you obtain and open a US Topo 7 2 -minute
quadrangle, then you can add or subtract layers
every fifth contour line above sea level is an index contour, so you
can count by five times the contour interval. The contour interval from them by using the menu along the left-hand
(elevation between any two contour lines) of these maps is 10 ft, so side of the image. You will also be given the option
the index contours are every 50 feet of elevation. of downloading a free TerraGo Toolbar that allows
you to measure distances, add comments, and merge
products with Google Maps™ or your GPS. The older
in black, with their names in black with yellow series of topographic maps are single-layer products
highlighting. Click on a quadrangle name to set a red scanned from paper maps.
balloon marker. Step 5: Printing Tips. You can print all or parts of the
Step 4: Obtain digital products for the location maps and orthoimages that you display in US Topo. The
®
of the balloon marker. Left click on the black dot GeoPDF files are very large (10–20 MB), so be patient
in the center of the red balloon marker to obtain and allow time for them to load, display, and print. To
a list of products available for the Step-3 location. print an entire map or orthoimage on letter-size paper,
The latest map series is US Topo, but older maps be sure to set your printer to the “shrink to fit” setting.
are also listed. Left click on “download” to display If you have a snipping tool on your computer, then you
or save your selection. The US Topo files are large can also snip the images as low-resolution JPEG files.
Topographic Maps and Orthoimages ■ 247