
Page 273 - Laboratory Manual in Physical Geology
P. 273
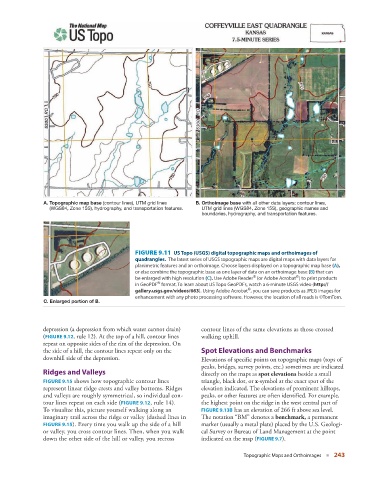
A. Topographic map base (contour lines), UTM grid lines  B. Orthoimage base with all other data layers: contour lines,
                         (WGS84, Zone 15S), hydrography, and transportation features.  UTM grid lines (WGS84, Zone 15S), geographic names and
                                                                            boundaries, hydrography, and transportation features.


                                                       FIGURE 9.11    US Topo (USGS) digital topographic maps and orthoimages of


                                                     quadrangles.  The latest series of USGS topographic maps are digital maps with data layers for


                                                     planimetric features and an orthoimage. Choose layers displayed on a topographic map base  (A),
                                                     or else combine the topographic base as one layer of data on an orthoimage base  (B)  that can
                                                                                             ®
                                                                                                           ®
                                                     be enlarged with high resolution  (C).  Use Adobe Reader    (or Adobe Acrobat   ) to print products
                                                             ®
                                                     in GeoPDF    format. To learn about US Topo GeoPDFs, watch a 6-minute USGS video (  http://
                                                                                           ®
                                                     gallery.usgs.gov/videos/663  ). Using Adobe Acrobat   , you can save products as JPEG images for
                                                     enhancement with any photo processing software. However, the location of all roads is ©TomTom.
                       C. Enlarged portion of B.
                         depression (a  depression from which water cannot drain)   contour lines of the same elevations as those crossed

                       (   FIGURE   9.12 , rule 12). At the top of a hill, contour lines   walking uphill.

                         repeat on opposite sides of the rim of the depression. On
                       the side of a hill, the contour lines repeat only on the       Spot Elevations and Benchmarks
                       downhill side of the depression.                      Elevations of specific points on topographic maps (tops of
                                                                           peaks, bridges, survey points, etc.) sometimes are indicated
                           Ridges and Valleys                              directly on the maps as  spot elevations  beside a small
                          FIGURE  9.15  shows how topographic contour lines   triangle, black dot, or  x -symbol at the exact spot of the


                         represent linear ridge crests and valley bottoms. Ridges   elevation indicated. The elevations of prominent hilltops,
                       and  valleys are roughly symmetrical, so individual con-  peaks, or other features are often identified. For example,
                       tour lines  repeat on each side (  FIGURE  9.12   , rule 14).   the highest point on the ridge in the west central part of


                       To visualize this,  picture yourself walking along an     FIGURE  9.13B  has an elevation of 266 ft above sea level.

                       imaginary trail across the ridge or valley (dashed lines in   The notation “BM” denotes a  benchmark  ,  a permanent
                         FIGURE  9.15 ). Every time you walk up the side of a hill   marker (usually a metal plate) placed by the U.S. Geologi-


                       or valley, you cross contour lines. Then, when you walk   cal Survey or Bureau of Land Management at the point
                       down the other side of the hill or valley, you recross   indicated on the map (  FIGURE   9.7   ).
                                                                                          Topographic Maps and Orthoimages   ■  243