
Page 272 - Laboratory Manual in Physical Geology
P. 272
108
100
50
Topographic map 0
D
100
Feet above sea level 50 Imaginary surface 50 C
Imaginary surface
100
B
Sea level
0
A
0 50 100 miles
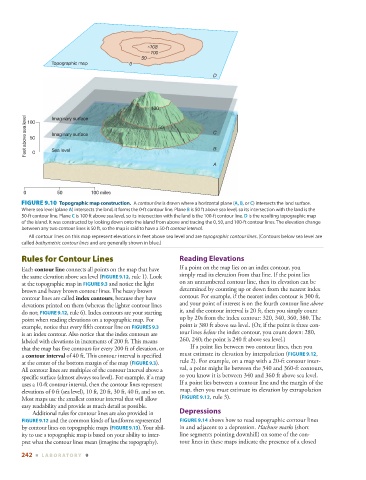
FIGURE 9.10 Topographic map construction. A contour line is drawn where a horizontal plane ( A, B, or C ) intersects the land surface.
Where sea level (plane A ) intersects the land, it forms the 0-ft contour line. Plane B is 50 ft above sea level, so its intersection with the land is the
50-ft contour line. Plane C is 100 ft above sea level, so its intersection with the land is the 100-ft contour line. D is the resulting topographic map
of the island. It was constructed by looking down onto the island from above and tracing the 0, 50, and 100-ft contour lines. The elevation change
between any two contour lines is 50 ft, so the map is said to have a 50-ft contour interval .
All contour lines on this map represent elevations in feet above sea level and are topographic contour lines . (Contours below sea level are
called bathymetric contour lines and are generally shown in blue.)
Rules for Contour Lines Reading Elevations
Each contour line connects all points on the map that have If a point on the map lies on an index contour, you
the same elevation above sea level ( FIGURE 9.12 , rule 1). Look simply read its elevation from that line. If the point lies
at the topographic map in FIGURE 9.3 and notice the light on an unnumbered contour line, then its elevation can be
brown and heavy brown contour lines. The heavy brown determined by counting up or down from the nearest index
contour lines are called index contours , because they have contour. For example, if the nearest index contour is 300 ft,
elevations printed on them (whereas the lighter contour lines and your point of interest is on the fourth contour line above
do not; FIGURE 9.12 , rule 6). Index contours are your starting it, and the contour interval is 20 ft, then you simply count
point when reading elevations on a topographic map. For up by 20s from the index contour: 320, 340, 360, 380. The
example, notice that every fifth contour line on FIGURES 9.3 point is 380 ft above sea level. (Or, if the point is three con-
is an index contour. Also notice that the index contours are tour lines below the index contour, you count down: 280,
labeled with elevations in increments of 200 ft. This means 260, 240; the point is 240 ft above sea level.)
that the map has five contours for every 200 ft of elevation, or If a point lies between two contour lines, then you
a contour interval of 40 ft. This contour interval is specified must estimate its elevation by interpolation ( FIGURE 9.12 ,
at the center of the bottom margin of the map ( FIGURE 9.3 ). rule 2). For example, on a map with a 20-ft contour inter-
All contour lines are multiples of the contour interval above a val, a point might lie between the 340 and 360-ft contours,
specific surface (almost always sea level). For example, if a map so you know it is between 340 and 360 ft above sea level.
uses a 10-ft contour interval, then the contour lines represent If a point lies between a contour line and the margin of the
elevations of 0 ft (sea level), 10 ft, 20 ft, 30 ft, 40 ft, and so on. map, then you must estimate its elevation by extrapolation
Most maps use the smallest contour interval that will allow ( FIGURE 9.12 , rule 3).
easy readability and provide as much detail as possible.
Additional rules for contour lines are also provided in Depressions
FIGURE 9.12 and the common kinds of landforms represented FIGURE 9.14 shows how to read topographic contour lines
by contour lines on topographic maps ( FIGURE 9.13 ). Your abil- in and adjacent to a depression. Hachure marks (short
ity to use a topographic map is based on your ability to inter- line segments pointing downhill) on some of the con-
pret what the contour lines mean (imagine the topography). tour lines in these maps indicate the presence of a closed
242 ■ L ABOR ATORY 9