
Page 271 - Laboratory Manual in Physical Geology
P. 271
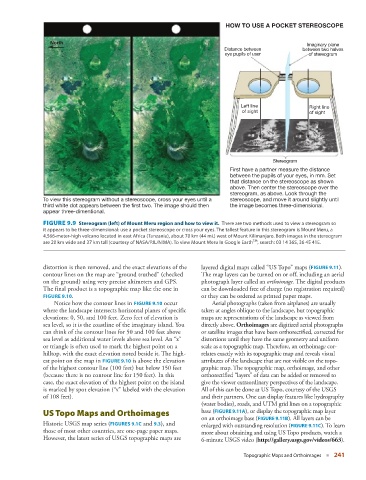
HOW TO USE A POCKET STEREOSCOPE


                         North                                                                                 Imaginary plane
                                                                                   Distance between          between two halves
                                                                                   eye pupils of user          of stereogram


                                                                                                      50  60


                                                                                         Left line             Right line
                                                                                         of sight              of sight


                                                                                                   Stereogram
                                                                                     First have a partner measure the distance
                                                                                     between the pupils of your eyes, in mm. Set
                                                                                     that distance on the stereoscope as shown
                                                                                     above. Then center the stereoscope over the
                                                                                     stereogram, as above. Look through the
                       To view this stereogram without a stereoscope, cross your eyes until a   stereoscope, and move it around slightly until
                       third white dot appears between the first two. The image should then   the image becomes three-dimensional.
                       appear three-dimentional.


                         FIGURE 9.9    Stereogram (left) of Mount Meru region and how to view it.  There are two methods used to view a stereogram so


                       it appears to be three-dimensional: use a pocket stereoscope or cross your eyes. The tallest feature in this stereogram is Mount Meru, a
                       4,566-meter-high volcano located in east Africa (Tanzania), about 70 km (44 mi.) west of Mount Kilimanjaro. Both images in the stereogram
                                                                                             TM
                       are 20 km wide and 37 km tall (courtesy of NASA/PJL/NIMA). To view Mount Meru In Google Earth   , search: 03 14 36S, 36 45 41E.
                         distortion is then removed, and the exact elevations of the   layered digital maps called “US Topo” maps (  FIGURE  9.11   ).

                       contour lines on the map are “ground truthed” (checked   The map layers can be turned on or off, including an aerial
                       on the ground) using very precise altimeters and GPS.   photograph layer called an  orthoimage . The digital products
                       The final product is a topographic map like the one in   can be downloaded free of charge (no registration required)
                         FIGURE  9.10   .                                  or they can be ordered as printed paper maps.

                            Notice how the contour lines in   FIGURE  9.10    occur     Aerial photographs (taken from airplanes) are usually

                       where the landscape intersects horizontal planes of specific   taken at angles oblique to the landscape, but topographic
                       elevations: 0, 50, and 100 feet. Zero feet of elevation is   maps are representations of the landscape as viewed from
                       sea level, so it is the coastline of the imaginary island. You   directly above.  Orthoimages  are digitized aerial photographs
                       can think of the contour lines for 50 and 100 feet above   or satellite images that have been orthorectified, corrected for
                       sea level as additional water levels above sea level. An “x”   distortions until they have the same geometry and uniform
                       or  triangle is often used to mark the highest point on a   scale as a topographic map. Therefore, an orthoimage cor-
                       hilltop, with the exact elevation noted beside it. The high-  relates exactly with its topographic map and reveals visual
                       est point on the map in   FIGURE  9.10    is above the elevation   attributes of the landscape that are not visible on the topo-

                       of the highest  contour line (100 feet) but below 150 feet   graphic map. The topographic map,  orthoimage, and other
                       (because there is no contour line for 150 feet). In this   orthorectified “layers” of data can be added or removed to
                       case, the exact elevation of the highest point on the island   give the viewer extraordinary  perspectives of the landscape.
                       is marked by spot  elevation (“x” labeled with the elevation   All of this can be done at US Topo, courtesy of the USGS
                       of 108 feet).                                       and their partners. One can display features like hydrography
                                                                           (water bodies), roads, and UTM grid lines on a topographic


                           US Topo Maps and Orthoimages                    base (  FIGURE  9.11A ), or display the topographic map layer

                                                                           on an orthoimage base (  FIGURE   9.11B ). All layers can be

                         Historic USGS map series ( FIGURES   9.1C    and    9.3   ), and   enlarged with  outstanding resolution (  FIGURE  9.11C   ). To learn

                       those of most other countries, are one-page paper maps.   more about obtaining and using US Topo products, watch a
                       However, the latest series of USGS topographic maps are   6-minute USGS video (  http://gallery.usgs.gov/videos/663  ).
                                                                                          Topographic Maps and Orthoimages   ■  241