
Page 343 - Laboratory Manual in Physical Geology
P. 343
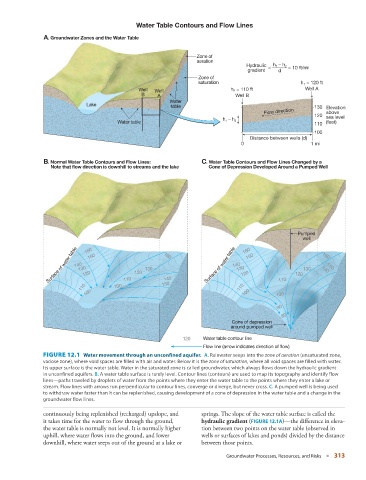
Water Table Contours and Flow Lines
                A. Groundwater Zones and the Water Table


                                                                   Zone of
                                                                   aeration
                                                                                   Hydraulic  =  h 1  – h 2  = 10 ft/mi
                                                                                    gradient  d
                                                                   Zone of
                                                                   saturation                        h 1  = 120 ft
                                               Well  Well                     h 2  = 110 ft            Well A
                                                B     A                         Well B
                                                          Water
                              Lake                        table                                           130 Elevation
                                                                                         Flow direction       above
                                                                                                          120  sea level
                                        Water table                        h 1  – h 2                     110  (feet)
                                                                                                          100
                                                                                    Distance between wells (d)
                                                                                  0                      1 mi


                B. Normal Water Table Contours and Flow Lines:      C. Water Table Contours and Flow Lines Changed by a
                  Note that flow direction is downhill to streams and the lake  Cone of Depression Developed Around a Pumped Well


                                                                                                    Pumped
                                                                                                      well
                 Surface of water table 140 130 120 150  120  130  160  Surface of water table 140 130 120 150  120 130  140
                                                                                  160
                              160
                                                                                                             160
                                                                                                              150
                                                        140
                            110        100  110        150                       110          110
                              100                                                 100        100

                                                                                              90
                                                                                               80
                                                                              Cone of depression
                                                                              around pumped well
                                                              120    Water table contour line
                                                                     Flow line (arrow indicates direction of flow)
                 FIGURE 12.1    Water movement through an unconfined aquifer.          A. Rainwater seeps into the  zone of aeration  (unsaturated zone,
               vadose zone), where void spaces are filled with air and water. Below it is the  zone of saturation,  where all void spaces are filled with water.
               Its upper surface is the water table. Water in the saturated zone is called groundwater, which always flows down the hydraulic gradient
               in unconfined aquifers.  B.  A water table surface is rarely level. Contour lines (contours) are used to map its topography and identify flow
               lines—paths traveled by droplets of water from the points where they enter the water table to the points where they enter a lake or
               stream. Flow lines with arrows run perpendicular to contour lines, converge or diverge, but never cross.  C.  A pumped well is being used
               to withdraw water faster than it can be replenished, causing development of a cone of depression in the water table and a change in the
               groundwater flow lines.

               continuously being replenished (recharged) upslope, and   springs. The slope of the water table surface is called the
               it takes time for the water to flow through the ground,     hydraulic gradient  (  FIGURE  12.1A   )—the difference in eleva-

               the water table is normally not level. It is normally higher   tion between two points on the water table (observed in
               uphill, where water flows into the ground, and lower   wells or surfaces of lakes and ponds) divided by the distance
               downhill, where water seeps out of the ground at a lake or   between those points.

                                                                             Groundwater Processes, Resources, and Risks   ■  313