
Page 339 - Laboratory Manual in Physical Geology
P. 339
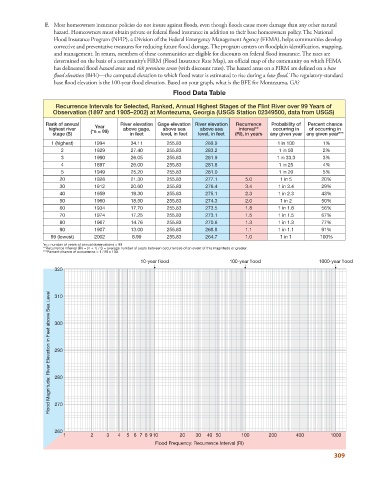
F.   Most homeowners insurance policies do not insure against floods, even though floods cause more damage than any other natural


                   hazard. Homeowners must obtain private or federal flood insurance in addition to their base homeowners policy. The National
                   Flood Insurance Program (NFIP), a Division of the Federal Emergency Management Agency (FEMA), helps communities develop
                   corrective and preventative measures for reducing future flood damage. The program centers on floodplain identification, mapping,
                   and management. In return, members of these communities are eligible for discounts on federal flood insurance. The rates are
                   determined on the basis of a community’s FIRM (Flood Insurance Rate Map), an official map of the community on which FEMA
                   has delineated flood  hazard areas  and  risk premium zones  (with discount rates). The hazard areas on a FIRM are defined on a  base
                   flood elevation  (BFE)—the computed elevation to which flood water is estimated to rise during a  base flood.  The regulatory-standard
                   base flood elevation is the 100-year flood elevation. Based on your graph, what is the BFE for Montezuma, GA?
                                                           Flood Data Table

                    Recurrence Intervals for Selected, Ranked, Annual Highest Stages of the Flint River over 99 Years of
                   Observation (1897 and 1905–2002) at Montezuma, Georgia (USGS Station 02349500, data from USGS)
                Rank of annual   Year    River elevation Gage elevation River elevation  Recurrence  Probability of  Percent chance
                 highest river  (*n = 99)  above gage,  above sea   above sea    interval**  occurring in  of occurring in
                   stage (S)                in feet    level, in feet  level, in feet  (RI), in years  any given year any given year***
                  1 (highest)    1994        34.11       255.83       289.9                   1 in 100       1%
                     2           1929        27.40       255.83       283.2                   1 in 50        2%
                     3           1990        26.05       255.83       281.9                  1 in 33.3       3%
                     4           1897        26.00       255.83       281.8                   1 in 25        4%
                     5           1949        25.20       255.83       281.0                   1 in 20        5%
                     20          1928        21.30       255.83       277.1        5.0         1 in 5       20%
                     30          1912        20.60       255.83       276.4        3.4        1 in 3.4      29%
                     40          1959        19.30       255.83       275.1        2.3        1 in 2.3      43%
                     50          1960        18.50       255.83       274.3        2.0         1 in 2       50%
                     60          1934        17.70       255.83       273.5        1.8        1 in 1.8      56%
                     70          1974        17.25       255.83       273.1        1.5        1 in 1.5      67%
                     80          1967        14.76       255.83       270.6        1.3        1 in 1.3      77%
                     90          1907        13.00       255.83       268.8        1.1        1 in 1.1      91%
                  99 (lowest)    2002        8.99        255.83       264.7        1.0         1 in 1       100%
               *n = number of years of annual observations = 99
               **Recurrence Interval (RI) = (n + 1) / S = average number of years between occurrences of an event of this magnitude or greater.
               ***Percent chance of occurrence = 1 / RI x 100.
                                                10-year flood                 100-year flood                1000-year flood
                   320


                  Flood Magnitude: River Elevation in Feet above Sea Level
                   310


                   300


                   290


                   280


                   270


                   260
                      1        2     3  4  5 6 7 8 9 10      20   30  40 50       100      200      400        1000
                                                     Flood Frequency: Recurrence Interval (RI)
                                                                                                                 309