
Page 154 - Lean six sigma demystified
P. 154
Chapter 4 exCeL Power TooLS for Lean Six Sigm a 133
• Top row: Summarize by subcategories.
• Center: Drop fields to be counted, summed, or averaged into the center.
4. To change how the data is summarized, use the Pivot Table Wizard or dou-
ble-click on the top left-hand cell. For online tutorials, see Google Excel
Pivot Table.
5. Select labels and totals, and draw charts using your summarized data.
? still struggling
Sign up for a free QI Macros webinar at www.qimacros.com/webinars/webinar-
dates.html.
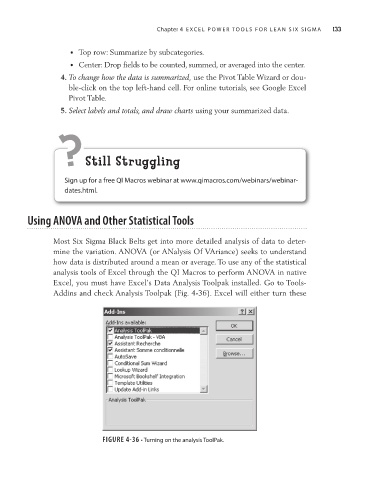
Using ANOVA and Other Statistical Tools
Most Six Sigma Black Belts get into more detailed analysis of data to deter-
mine the variation. ANOVA (or ANalysis Of VAriance) seeks to understand
how data is distributed around a mean or average. To use any of the statistical
analysis tools of Excel through the QI Macros to perform ANOVA in native
Excel, you must have Excel’s Data Analysis Toolpak installed. Go to Tools-
Addins and check Analysis Toolpak (Fig. 4-36). Excel will either turn these
FIGURE 4-36 • Turning on the analysis ToolPak.