
Page 151 - Lean six sigma demystified
P. 151
130 Lean Six Sigma DemystifieD
• Reduce variation using the control charts and histograms.
• Reduce measurement error using the Gage R&R template.
• Design for Lean Six Sigma using the Failure Modes and Effects Analysis
(FMEA), QFD House of Quality, Pugh Concept Selection Matrix, and
Design of Experiments.
• Project management and planning using the Gantt chart, action plan, and
ROI calculator.
Put Your Whole QI Story in One Workbook
Because the QI Macros are an all-in-one toolkit for Lean Six Sigma, you
can put your entire improvement story in one workbook by simply adding
worksheets. Let’s say you’ve created a control and Pareto chart in one
workbook. After you choose Ishikawa/Fish bone from the Fill-in-the-
Blanks templates, just go to Edit-Move or Copy Sheet to move the tem-
plate into the existing workbook. It’s a great way to keep all of your
information in one place.
Data Transformation
Convert Tables of Data from One Size to Another
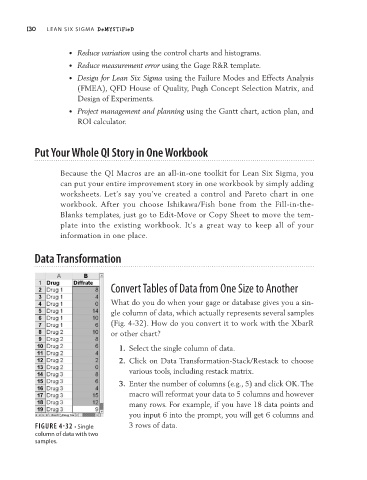
What do you do when your gage or database gives you a sin-
gle column of data, which actually represents several samples
(Fig. 4-32). How do you convert it to work with the XbarR
or other chart?
1. Select the single column of data.
2. Click on Data Transformation-Stack/Restack to choose
various tools, including restack matrix.
3. Enter the number of columns (e.g., 5) and click OK. The
macro will reformat your data to 5 columns and however
many rows. For example, if you have 18 data points and
you input 6 into the prompt, you will get 6 columns and
FIGURE 4-32 • Single 3 rows of data.
column of data with two
samples.