
Page 148 - Lean six sigma demystified
P. 148
Chapter 4 e xC e L Power Too LS for Lean Six Sigm a 127
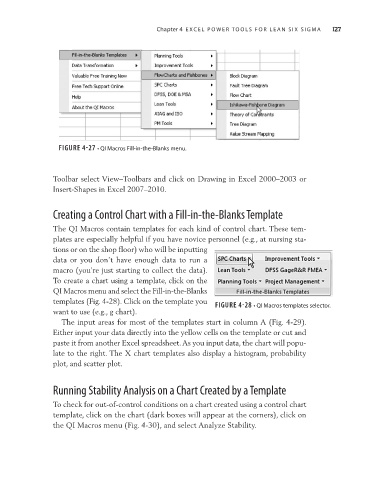
FIGURE 4-27 • QI Macros Fill-in-the-Blanks menu.
Toolbar select View–Toolbars and click on Drawing in Excel 2000–2003 or
Insert-Shapes in Excel 2007–2010.
Creating a Control Chart with a Fill-in-the-Blanks Template
The QI Macros contain templates for each kind of control chart. These tem-
plates are especially helpful if you have novice personnel (e.g., at nursing sta-
tions or on the shop floor) who will be inputting
data or you don’t have enough data to run a
macro (you’re just starting to collect the data).
To create a chart using a template, click on the
QI Macros menu and select the Fill-in-the-Blanks
templates (Fig. 4-28). Click on the template you FIGURE 4-28 • QI Macros templates selector.
want to use (e.g., g chart).
The input areas for most of the templates start in column A (Fig. 4-29).
Either input your data directly into the yellow cells on the template or cut and
paste it from another Excel spreadsheet. As you input data, the chart will popu-
late to the right. The X chart templates also display a histogram, probability
plot, and scatter plot.
Running Stability Analysis on a Chart Created by a Template
To check for out-of-control conditions on a chart created using a control chart
template, click on the chart (dark boxes will appear at the corners), click on
the QI Macros menu (Fig. 4-30), and select Analyze Stability.