
Page 145 - Lean six sigma demystified
P. 145
124 Lean Six Sigma DemystifieD
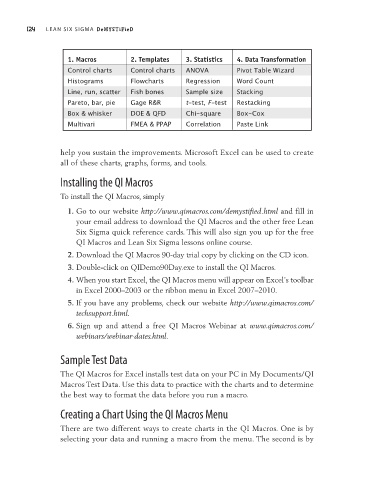
1. Macros 2. Templates 3. Statistics 4. Data Transformation
Control charts Control charts ANOVA Pivot Table Wizard
Histograms Flowcharts Regression Word Count
Line, run, scatter Fish bones Sample size Stacking
Pareto, bar, pie Gage R&R t-test, F-test Restacking
Box & whisker DOE & QFD Chi-square Box-Cox
Multivari FMEA & PPAP Correlation Paste Link
help you sustain the improvements. Microsoft Excel can be used to create
all of these charts, graphs, forms, and tools.
Installing the QI Macros
To install the QI Macros, simply
1. Go to our website http://www.qimacros.com/demystified.html and fill in
your email address to download the QI Macros and the other free Lean
Six Sigma quick reference cards. This will also sign you up for the free
QI Macros and Lean Six Sigma lessons online course.
2. Download the QI Macros 90-day trial copy by clicking on the CD icon.
3. Double-click on QIDemo90Day.exe to install the QI Macros.
4. When you start Excel, the QI Macros menu will appear on Excel’s toolbar
in Excel 2000–2003 or the ribbon menu in Excel 2007–2010.
5. If you have any problems, check our website http://www.qimacros.com/
techsupport.html.
6. Sign up and attend a free QI Macros Webinar at www.qimacros.com/
webinars/webinar-dates.html.
Sample Test Data
The QI Macros for Excel installs test data on your PC in My Documents/QI
Macros Test Data. Use this data to practice with the charts and to determine
the best way to format the data before you run a macro.
Creating a Chart Using the QI Macros Menu
There are two different ways to create charts in the QI Macros. One is by
selecting your data and running a macro from the menu. The second is by