
Page 147 - Lean six sigma demystified
P. 147
126 Lean Six Sigma DemystifieD
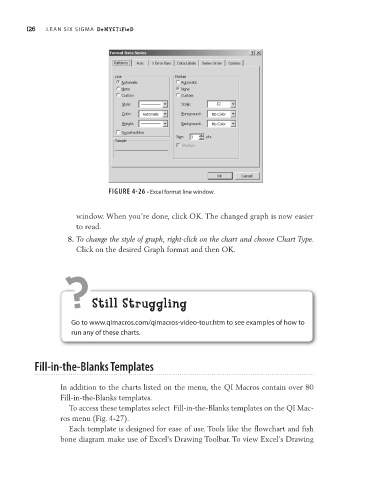
FIGURE 4-26 • Excel format line window.
window. When you’re done, click OK. The changed graph is now easier
to read.
8. To change the style of graph, right-click on the chart and choose Chart Type.
Click on the desired Graph format and then OK.
? still struggling
Go to www.qimacros.com/qimacros-video-tour.htm to see examples of how to
run any of these charts.
Fill-in-the-Blanks Templates
In addition to the charts listed on the menu, the QI Macros contain over 80
Fill-in-the-Blanks templates.
To access these templates select Fill-in-the-Blanks templates on the QI Mac-
ros menu (Fig. 4-27).
Each template is designed for ease of use. Tools like the flowchart and fish
bone diagram make use of Excel’s Drawing Toolbar. To view Excel’s Drawing