
Page 149 - Lean six sigma demystified
P. 149
128 Lean Six Sigma DemystifieD
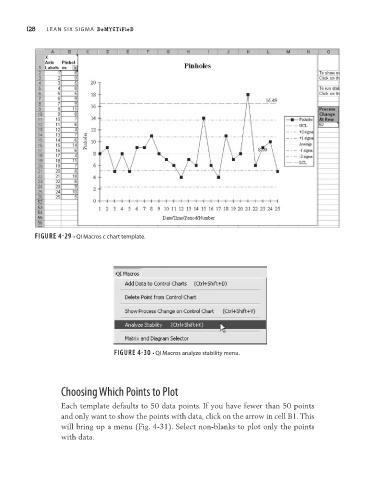
FIGURE 4-29 • QI Macros c chart template.
FIGURE 4-30 • QI Macros analyze stability menu.
Choosing Which Points to Plot
Each template defaults to 50 data points. If you have fewer than 50 points
and only want to show the points with data, click on the arrow in cell B1. This
will bring up a menu (Fig. 4-31). Select non-blanks to plot only the points
with data.