
Page 146 - Lean six sigma demystified
P. 146
Chapter 4 e xC e L Power Too LS for Lean Six Sigm a 125
using the Fill-in-the-Blanks chart templates. To create a chart
using a macro from the menu, just select the data to graph.
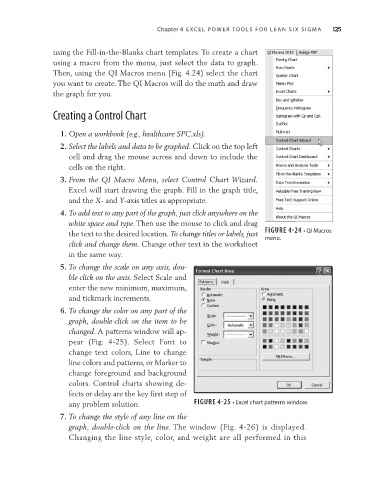
Then, using the QI Macros menu (Fig. 4.24) select the chart
you want to create. The QI Macros will do the math and draw
the graph for you.
Creating a Control Chart
1. Open a workbook (e.g., healthcare SPC.xls).
2. Select the labels and data to be graphed. Click on the top left
cell and drag the mouse across and down to include the
cells on the right.
3. From the QI Macro Menu, select Control Chart Wizard.
Excel will start drawing the graph. Fill in the graph title,
and the X- and Y-axis titles as appropriate.
4. To add text to any part of the graph, just click anywhere on the
white space and type. Then use the mouse to click and drag
the text to the desired location. To change titles or labels, just FIGURE 4-24 • QI Macros
menu.
click and change them. Change other text in the worksheet
in the same way.
5. To change the scale on any axis, dou-
ble-click on the axis. Select Scale and
enter the new minimum, maximum,
and tickmark increments.
6. To change the color on any part of the
graph, double-click on the item to be
changed. A patterns window will ap-
pear (Fig. 4-25). Select Font to
change text colors, Line to change
line colors and patterns, or Marker to
change foreground and background
colors. Control charts showing de-
fects or delay are the key first step of
any problem solution. FIGURE 4-25 • Excel chart patterns window.
7. To change the style of any line on the
graph, double-click on the line. The window (Fig. 4-26) is displayed.
Changing the line style, color, and weight are all performed in this