
Page 166 - Lean six sigma demystified
P. 166
Chapter 4 e xC e L Power Too LS for Lean Six Sigm a 145
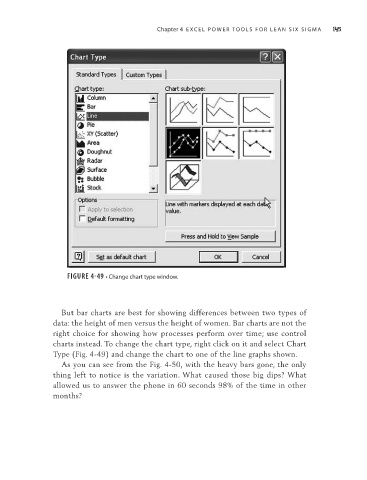
FIGURE 4-49 • Change chart type window.
But bar charts are best for showing differences between two types of
data: the height of men versus the height of women. Bar charts are not the
right choice for showing how processes perform over time; use control
charts instead. To change the chart type, right click on it and select Chart
Type (Fig. 4-49) and change the chart to one of the line graphs shown.
As you can see from the Fig. 4-50, with the heavy bars gone, the only
thing left to notice is the variation. What caused those big dips? What
allowed us to answer the phone in 60 seconds 98% of the time in other
months?