
Page 165 - Lean six sigma demystified
P. 165
144 Lean Six Sigma DemystifieD
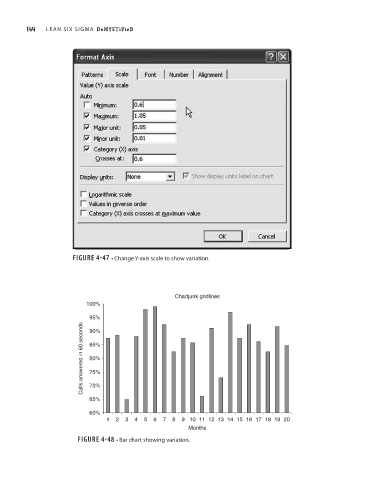
FIGURE 4-47 • Change Y-axis scale to show variation.
Chartjunk gridlines
100%
95%
Calls answered in 60 seconds 85%
90%
80%
75%
70%
65%
60%
1 2 3 4 5 6 7 8 9 10 11 12 13 14 15 16 17 18 19 20
Months
FIGURE 4-48 • Bar chart showing variation.