
Page 167 - Lean six sigma demystified
P. 167
146 Lean Six Sigma DemystifieD
Calls answered in 60 seconds
100%
95%
Calls answered in 60 seconds 85%
90%
80%
75%
70%
65%
60%
1 2 3 4 5 6 7 8 91011121314151617181920
Months
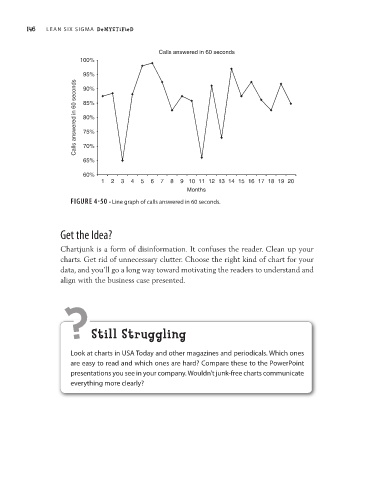
FIGURE 4-50 • Line graph of calls answered in 60 seconds.
Get the Idea?
Chartjunk is a form of disinformation. It confuses the reader. Clean up your
charts. Get rid of unnecessary clutter. Choose the right kind of chart for your
data, and you’ll go a long way toward motivating the readers to understand and
align with the business case presented.
? still struggling
Look at charts in USA Today and other magazines and periodicals. Which ones
are easy to read and which ones are hard? Compare these to the PowerPoint
presentations you see in your company. Wouldn’t junk-free charts communicate
everything more clearly?