
Page 162 - Lean six sigma demystified
P. 162
Chapter 4 e xC e L Power Too LS for Lean Six Sigm a 141
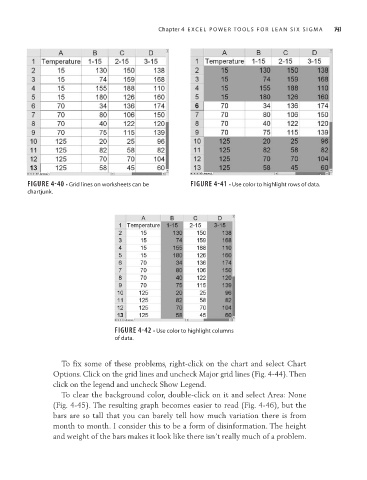
FIGURE 4-40 • Grid lines on worksheets can be FIGURE 4-41 • Use color to highlight rows of data.
chartjunk.
FIGURE 4-42 • Use color to highlight columns
of data.
To fix some of these problems, right-click on the chart and select Chart
Options. Click on the grid lines and uncheck Major grid lines (Fig. 4-44). Then
click on the legend and uncheck Show Legend.
To clear the background color, double-click on it and select Area: None
(Fig. 4-45). The resulting graph becomes easier to read (Fig. 4-46), but the
bars are so tall that you can barely tell how much variation there is from
month to month. I consider this to be a form of disinformation. The height
and weight of the bars makes it look like there isn’t really much of a problem.