
Page 163 - Lean six sigma demystified
P. 163
142 Lean Six Sigma DemystifieD
Calls answered in 60 seconds
120%
Calls answered in 60 seconds
100%
80%
60%
40%
20%
0%
1 2345678 910111213 14 15 16 17 18 19 20
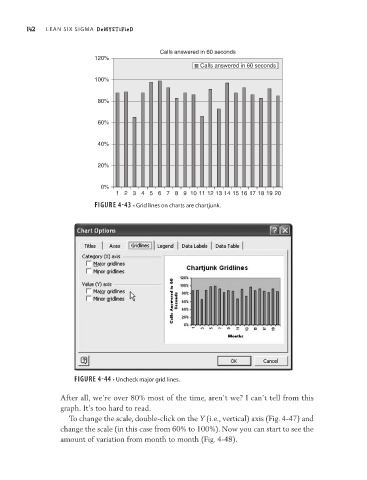
FIGURE 4-43 • Grid lines on charts are chartjunk.
FIGURE 4-44 • Uncheck major grid lines.
After all, we’re over 80% most of the time, aren’t we? I can’t tell from this
graph. It’s too hard to read.
To change the scale, double-click on the Y (i.e., vertical) axis (Fig. 4-47) and
change the scale (in this case from 60% to 100%). Now you can start to see the
amount of variation from month to month (Fig. 4-48).