
Page 224 - Lean six sigma demystified
P. 224
202 Lean Six Sigma DemystifieD
The Problem-Solving Process
The problem-solving process begins with a control chart of current performance.
(With the QI Macros, it’s so easy to draw a control chart that it’s silly to use a
line graph. And you’ll need the control chart to monitor and sustain the
improvement.) You then use the detail behind the performance data to create
a Pareto chart.
Control Charts
Control charts show performance over time. So I’m always looking for some
orientation of the data that goes from first to last. This could be production
sample numbers, dates, times, or whatever.
The problem-solving process also implies that there is some kind of error,
mistake, or defect. So I’m looking for attribute data about defects (i.e., mis-
takes, errors, or out of spec). I’m not looking for variable data like money or
cycle time or length or weight. Let’s look at some sample defect data from the
AIAG (Fig. 5-36).
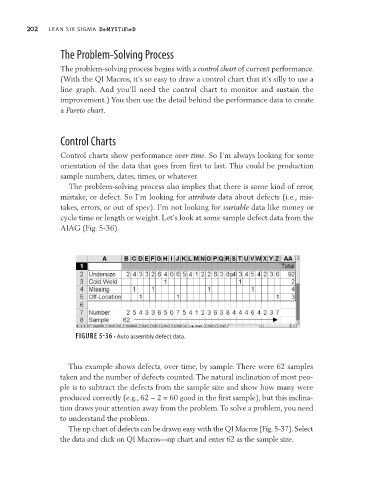
FIGURE 5-36 • Auto assembly defect data.
This example shows defects, over time, by sample. There were 62 samples
taken and the number of defects counted. The natural inclination of most peo-
ple is to subtract the defects from the sample size and show how many were
produced correctly (e.g., 62 − 2 = 60 good in the first sample), but this inclina-
tion draws your attention away from the problem. To solve a problem, you need
to understand the problem.
The np chart of defects can be drawn easy with the QI Macros (Fig. 5-37). Select
the data and click on QI Macros—np chart and enter 62 as the sample size.