
Page 225 - Lean six sigma demystified
P. 225
Chapter 5 Redu C ing d efe C t S with Six Sigm a 203
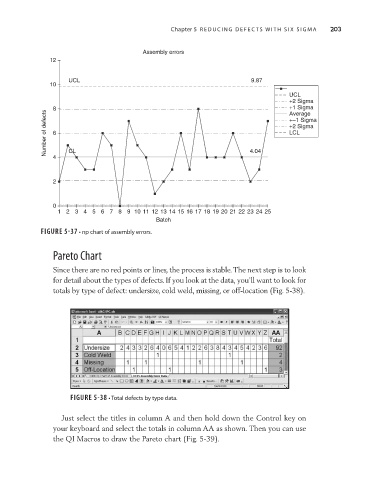
Assembly errors
12
UCL 9.87
10
UCL
+2 Sigma
8 +1 Sigma
Number of defects 6 4 CL 4.04 +2 Sigma
Average
+–1 Sigma
LCL
2
0
123456789 10 11 12 13 14 15 16 17 18 19 20 21 22 23 24 25
Batch
FIGURE 5-37 • np chart of assembly errors.
Pareto Chart
Since there are no red points or lines, the process is stable. The next step is to look
for detail about the types of defects. If you look at the data, you’ll want to look for
totals by type of defect: undersize, cold weld, missing, or off-location (Fig. 5-38).
FIGURE 5-38 • Total defects by type data.
Just select the titles in column A and then hold down the Control key on
your keyboard and select the totals in column AA as shown. Then you can use
the QI Macros to draw the Pareto chart (Fig. 5-39).