
Page 228 - Lean six sigma demystified
P. 228
206 Lean Six Sigma DemystifieD
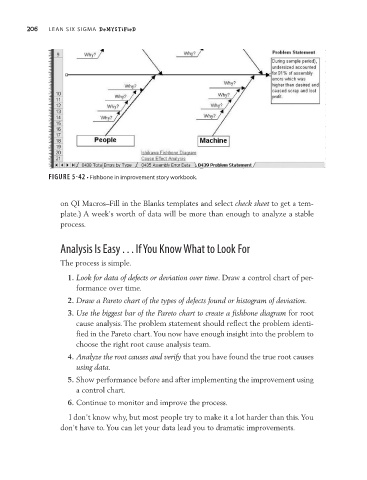
FIGURE 5-42 • Fishbone in improvement story workbook.
on QI Macros–Fill in the Blanks templates and select check sheet to get a tem-
plate.) A week’s worth of data will be more than enough to analyze a stable
process.
Analysis Is Easy . . . If You Know What to Look For
The process is simple.
1. Look for data of defects or deviation over time. Draw a control chart of per-
formance over time.
2. Draw a Pareto chart of the types of defects found or histogram of deviation.
3. Use the biggest bar of the Pareto chart to create a fishbone diagram for root
cause analysis. The problem statement should reflect the problem identi-
fied in the Pareto chart. You now have enough insight into the problem to
choose the right root cause analysis team.
4. Analyze the root causes and verify that you have found the true root causes
using data.
5. Show performance before and after implementing the improvement using
a control chart.
6. Continue to monitor and improve the process.
I don’t know why, but most people try to make it a lot harder than this. You
don’t have to. You can let your data lead you to dramatic improvements.