
Page 226 - Lean six sigma demystified
P. 226
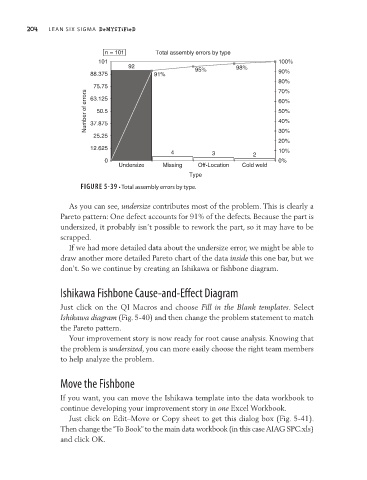
204        Lean Six Sigma  DemystifieD


                                    n = 101       Total assembly errors by type
                                  101                                                100%
                                           92                95%         98%
                                88.375            91%                                90%
                                                                                     80%
                                 75.75                                               70%
                               Number of errors  37.875                              60%
                                63.125
                                  50.5
                                                                                     50%
                                                                                     40%

                                 25.25                                               30%
                                                                                     20%
                                12.625
                                                       4          3           2      10%
                                    0                                                0%
                                        Undersize   Missing   Off-Location  Cold weld
                                                            Type
                             FIGURE 5-39 • Total assembly errors by type.

                          As you can see, undersize contributes most of the problem. This is clearly a
                        Pareto pattern: One defect accounts for 91% of the defects. Because the part is
                        undersized, it probably isn’t possible to rework the part, so it may have to be
                        scrapped.
                          If we had more detailed data about the undersize error, we might be able to
                        draw another more detailed Pareto chart of the data inside this one bar, but we
                        don’t. So we continue by creating an Ishikawa or fishbone diagram.


                        Ishikawa Fishbone Cause-and-Effect Diagram

                        Just click on the QI Macros and choose Fill in the Blank templates. Select
                        Ishikawa diagram (Fig. 5-40) and then change the problem statement to match

                        the Pareto pattern.
                          Your improvement story is now ready for root cause analysis. Knowing that
                        the problem is undersized, you can more easily choose the right team members
                        to help analyze the problem.

                        Move the Fishbone

                        If you want, you can move the Ishikawa template into the data workbook to
                        continue developing your improvement story in one Excel Workbook.
                          Just click on Edit–Move or Copy sheet to get this dialog box (Fig. 5-41).
                        Then change the “To Book” to the main data workbook (in this case AIAG SPC.xls)
                        and click OK.