
Page 227 - Lean six sigma demystified
P. 227
Chapter 5 Redu C ing d efe C t S with Six Sigm a 205
Materials Process/methods
Why?
Why?
Why? Why?
Why? Why?
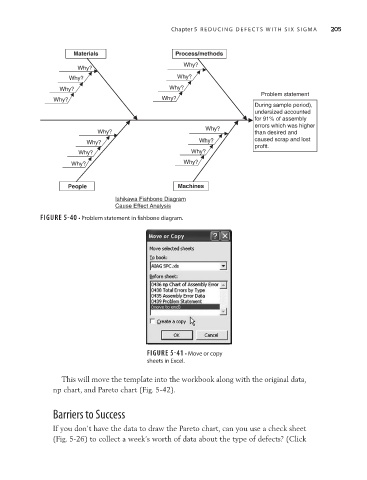
Problem statement
Why? Why?
During sample period),
undersized accounted
for 91% of assembly
errors which was higher
Why?
Why? than desired and
Why? Why? caused scrap and lost
profit.
Why? Why?
Why? Why?
People Machines
Ishikawa Fishbone Diagram
Cause Effect Analysis
FIGURE 5-40 • Problem statement in fishbone diagram.
FIGURE 5-41 • Move or copy
sheets in Excel.
This will move the template into the workbook along with the original data,
np chart, and Pareto chart (Fig. 5-42).
Barriers to Success
If you don’t have the data to draw the Pareto chart, can you use a check sheet
(Fig. 5-26) to collect a week’s worth of data about the type of defects? (Click