
Page 114 - Materials Chemistry, Second Edition
P. 114
Will the well run dry? Developments in water resource planning and impact assessment
Equation 8.1 illustrates that the power used by pumps in water systems is based on flow rate 101
and pumping head.
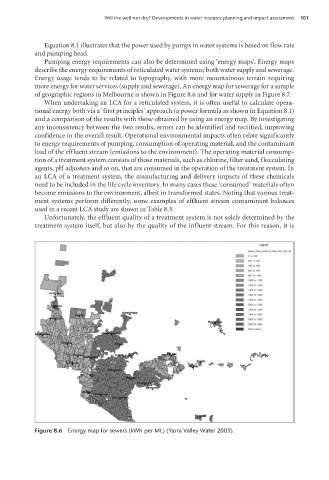
Pumping energy requirements can also be determined using ‘energy maps’. Energy maps
describe the energy requirements of reticulated water systems; both water supply and sewerage.
Energy usage tends to be related to topography, with more mountainous terrain requiring
more energy for water services (supply and sewerage). An energy map for sewerage for a sample
of geographic regions in Melbourne is shown in Figure 8.6 and for water supply in Figure 8.7.
When undertaking an LCA for a reticulated system, it is often useful to calculate opera-
tional energy both via a ‘first principles’ approach (a power formula as shown in Equation 8.1)
and a comparison of the results with those obtained by using an energy map. By investigating
any inconsistency between the two results, errors can be identified and rectified, improving
confidence in the overall result. Operational environmental impacts often relate significantly
to energy requirements of pumping, consumption of operating material, and the contaminant
load of the effluent stream (emissions to the environment). The operating material consump-
tion of a treatment system consists of those materials, such as chlorine, filter sand, flocculating
agents, pH adjusters and so on, that are consumed in the operation of the treatment system. In
an LCA of a treatment system, the manufacturing and delivery impacts of these chemicals
need to be included in the life cycle inventory. In many cases these ‘consumed’ materials often
become emissions to the environment, albeit in transformed states. Noting that various treat-
ment systems perform differently, some examples of effluent stream contaminant balances
used in a recent LCA study are shown in Table 8.3.
Unfortunately, the effluent quality of a treatment system is not solely determined by the
treatment system itself, but also by the quality of the influent stream. For this reason, it is
Figure 8.6 Energy map for sewers (kWh per ML) (Yarra Valley Water 2005).
100804•Life Cycle Assessment 5pp.indd 101 17/02/09 12:46:21 PM