
Page 117 - Materials Chemistry, Second Edition
P. 117
Life Cycle Assessment: Principles, Practice and Prospects
104
Table 8.4 Seasonal water usage data (Hallmann et al. 2003)
Share of annual Average amount of water applied/
Season garden use garden/day (L)
Summer 66% 536.7 (90 days)
Autumn 22% 177.4 (92 days)
Winter 0% 0 (92 days)
Spring 12% 93.3 (91 days)
Total 100% Total annual water use: 73.1kL
Mismatches in water systems are usually dealt with by adding storage capacity, although
‘behavioural demand side solutions’ are becoming more common. Analysis of daily supply and
demand for water allows impacts of various supplementary tank sizes to be considered. Usually,
environmental impacts are minimised in supplementary water systems when only a portion of
water is supplied through the supplementary system. This luxury does not exist when a water
supply system is isolated from reticulated supply and must carry the expected demand through-
out the year.
The influence of social practice extends beyond user ‘behaviour’, since the size of the water
supply system determines capacity for future use – and there is a tendency for capacity to be
fully used. New uses may also be found for extra capacity. Hence, where new supply sources
such as desalinisation plants are envisaged, with significant, long-term investment in new
infrastructure and supply capacity, new consumption outlets may be identified. Following the
drought period which provides the impetus for such infrastructure investment, new uses for
the water and infrastructure are found, in the same way that car ownership leads to more
vehicle kilometres travelled.
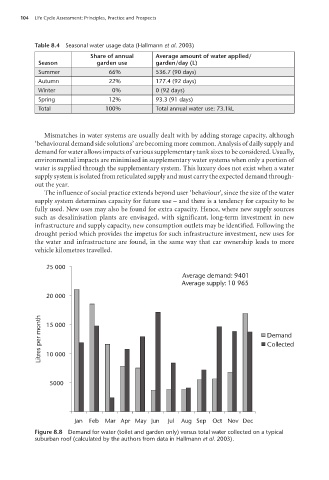
25 000
Average demand: 9401
Average supply: 10 965
20 000
Litres per month 15 000 Demand
Collected
10 000
5000
Jan Feb Mar AprMay Jun Jul Aug Sep Oct Nov Dec
Figure 8.8 Demand for water (toilet and garden only) versus total water collected on a typical
suburban roof (calculated by the authors from data in Hallmann et al. 2003).
100804•Life Cycle Assessment 5pp.indd 104 17/02/09 12:46:21 PM