Page 180 - MATLAB an introduction with applications
P. 180

Control Systems ———  165


                                                       Unit-ramp response
                                         10


                                          8
                                                       Unit-ramp input
                                          6
                                        Output

                                          4                        Output


                                          2


                                          0
                                           0       2       4      6       8       10
                                                            t Sec
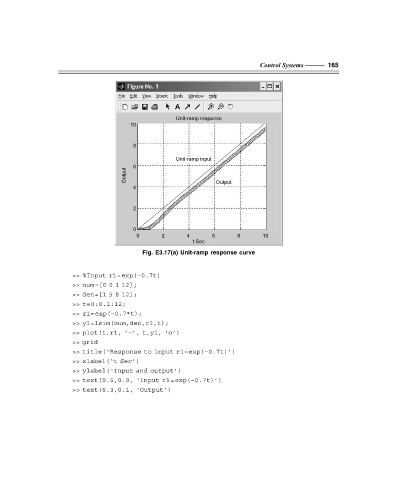
                                             Fig. E3.17(a) Unit-ramp response curve


                       >> %Input r1=exp(–0.7t)
                       >> num=[0 0 1 12];
                       >> den=[1 5 8 12];
                       >> t=0:0.1:12;
                       >> r1=exp(–0.7*t);
                       >> y1=lsim(num,den,r1,t);
                       >> plot(t,r1, ‘–’, t,y1, ‘o’)
                       >> grid
                       >> title(‘Response to input r1=exp(–0.7t)’)
                       >> xlabel(‘t Sec’)
                       >> ylabel(‘Input and output’)
                       >> text(0.5,0.9, ‘Input r1=exp(–0.7t)’)
                       >> text(6.3,0.1, ‘Output’)


                   F:\Final Book\Sanjay\IIIrd Printout\Dt. 10-03-09
   175   176   177   178   179   180   181   182   183   184   185