
Page 194 - MATLAB an introduction with applications
P. 194
Control Systems ——— 179
y 1 10 x 1
=
y 2 01 x 2
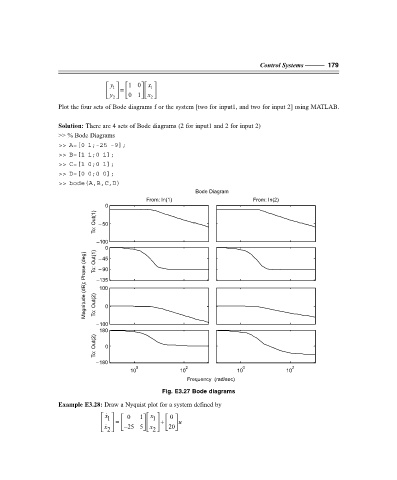
Plot the four sets of Bode diagrams f or the system [two for input1, and two for input 2] using MATLAB.
Solution: There are 4 sets of Bode diagrams (2 for input1 and 2 for input 2)
>> % Bode Diagrams
>> A=[0 1;-25 -9];
>> B=[1 1;0 1];
>> C=[1 0;0 1];
>> D=[0 0;0 0];
>> bode(A,B,C,D)
Bode Diagram
From: In(1) From: In(2)
0
Out(1) –50
To:
–100
0
(deg) Out(1) –45
Phase To: –135
–90
(dB); 100
Magnitude Out(2) To: 0
–100
180
Out(2) 0
To:
–180
0 2 0 2
10 10 10 10
Frequency (rad/sec)
Fig. E3.27 Bode diagrams
Example E3.28: Draw a Nyquist plot for a system defined by
x 0 1 x 0
1
1
+
= u
x 2 − 25 5 x 2 20
F:\Final Book\Sanjay\IIIrd Printout\Dt. 10-03-09