
Page 195 - MATLAB an introduction with applications
P. 195
180 ——— MATLAB: An Introduction with Applications
x 1
y = [10 ] + [0]u
x 2
using MATLAB.
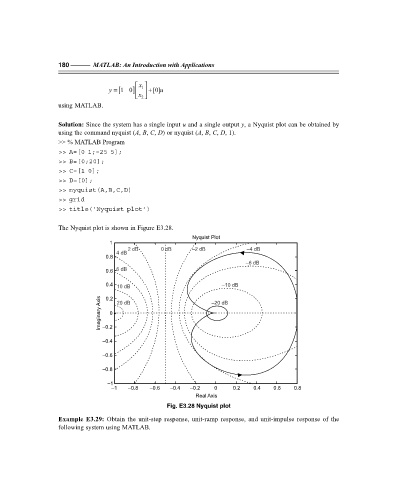
Solution: Since the system has a single input u and a single output y, a Nyquist plot can be obtained by
using the command nyquist (A, B, C, D) or nyquist (A, B, C, D, 1).
>> % MATLAB Program
>> A=[0 1;–25 5];
>> B=[0;20];
>> C=[1 0];
>> D=[0];
>> nyquist(A,B,C,D)
>> grid
>> title(‘Nyquist plot’)
The Nyquist plot is shown in Figure E3.28.
Nyquist Plot
1
2dB 0dB –2 dB –4 dB
4dB
0.8
–6 dB
0.6 6dB
0.4 10 dB –10 dB
Imaginary Axis –0.2 0 20 dB –20 dB
0.2
–0.4
–0.6
–0.8
–1
–1 –0.8 –0.6 –0.4 –0.2 0 0.2 0.4 0.6 0.8
Real Axis
Fig. E3.28 Nyquist plot
Example E3.29: Obtain the unit-step response, unit-ramp response, and unit-impulse response of the
following system using MATLAB.
F:\Final Book\Sanjay\IIIrd Printout\Dt. 10-03-09