
Page 158 - MATLAB Recipes for Earth Sciences
P. 158
7.2 The GSHHS Shoreline Data Set 153
42.915987 0.028749
42.918921 0.032562
42.922441 0.035789
(cont'd)
The NaN·s perform two functions: they provide a means for identifying break
points in the data. They also serve as pen-up commands when the Mapping
Toolbox plots vector maps. The shorelines can be displayed by using
data = load('coastline.txt');
plot(data(:,1),data(:,2),'k'); axis equal
xlabel('Longitude'), ylabel('Latitude')
More advanced plotting functions are contained in the Mapping Toolbox,
which allow to generate the following plot (Fig. 7.1):
axesm('MapProjection','mercator', ...
'MapLatLimit',[0 15], ...
GSHHS Data Set
15
10
Latitude
5
0
36 38 40 42 44 46 48 50 52 54
Longitude
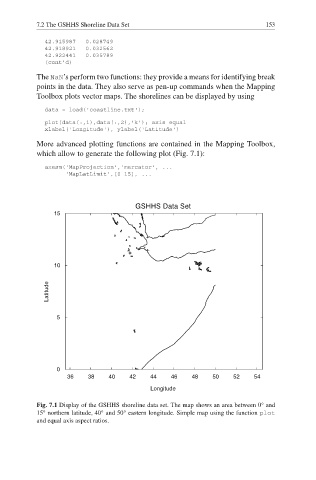
Fig. 7.1 Display of the GSHHS shoreline data set. The map shows an area between 0° and
15° northern latitude, 40° and 50° eastern longitude. Simple map using the function plot
and equal axis aspect ratios.