Page 163 - MATLAB Recipes for Earth Sciences
P. 163

158                                                     7 Spatial Data

                 colormap(flipud(gray.^4))
               axis equal, view(0,90)
               colorbar


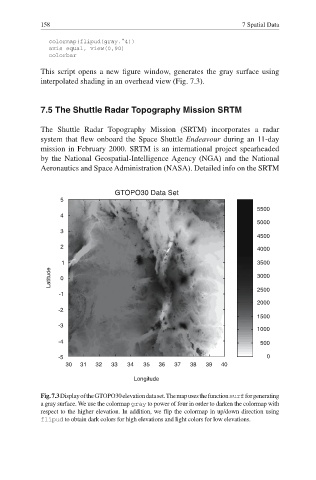
            This script opens a new figure window, generates the gray surface using
            interpolated shading in an overhead view (Fig. 7.3).


            7.5 The Shuttle Radar Topography Mission  SRTM


            The  Shuttle Radar  Topography Mission (SRTM) incorporates a radar
            system that flew onboard the Space Shuttle Endeavour during an 11-day

            mission in February 2000. SRTM is an international project spearheaded
            by the National Geospatial-Intelligence Agency (NGA) and the National
            Aeronautics and Space Administration (NASA). Detailed info on the SRTM


                                 GTOPO30 Data Set
                  5
                                                                         5500
                  4
                                                                         5000
                  3
                                                                         4500
                  2                                                      4000

                  1                                                      3500
               Latitude  0                                               3000


                                                                         2500
                 -1
                                                                         2000
                 -2
                                                                         1500
                 -3
                                                                         1000
                 -4                                                      500

                 -5                                                        0
                   30  31   32  33  34   35  36   37  38  39   40
                                      Longitude

            Fig. 7.3 Display of the GTOPO30 elevation data set. The map uses the function surf for generating
            a gray surface. We use the colormap gray to power of four in order to darken the colormap with
            respect to the higher elevation. In addition, we flip the colormap in up/down direction using

            flipud to obtain dark colors for high elevations and light colors for low elevations.
   158   159   160   161   162   163   164   165   166   167   168