Page 161 - MATLAB Recipes for Earth Sciences
P. 161

156                                                     7 Spatial Data

            function surf.

               surf(LON,LAT,ETOPO2)
                 shading interp
               axis equal, view(0,90)
                 colorbar

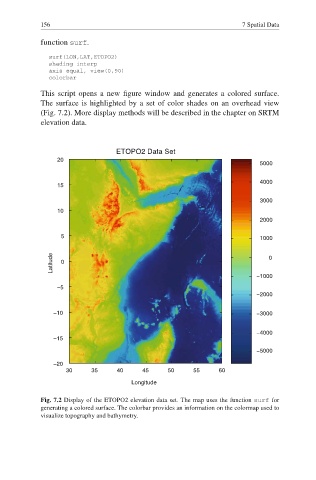
            This script opens a new figure window and generates a colored surface.

            The surface is highlighted by a set of color shades on an overhead view
            (Fig. 7.2). More display methods will be described in the chapter on SRTM
            elevation data.


                                 ETOPO2 Data Set
                 20
                                                                         5000

                                                                         4000
                 15
                                                                         3000
                 10
                                                                         2000

                  5                                                      1000

                Latitude  0                                                 0


                                                                        −1000
                 −5
                                                                        −2000

                −10                                                     −3000

                                                                        −4000
                −15
                                                                        −5000

                −20
                   30     35      40     45     50     55     60
                                      Longitude

            Fig. 7.2 Display of the ETOPO2 elevation data set. The map uses the function surf for
            generating a colored surface. The colorbar provides an information on the colormap used to
            visualize topography and bathymetry.
   156   157   158   159   160   161   162   163   164   165   166