
Page 166 - MATLAB Recipes for Earth Sciences
P. 166
7.6 Gridding and Contouring Background 161
After having generated the shaded-relief map, the graph has to be exported
onto a graphics file (Fig. 7.4). For instance, the figure may be written onto a
JPEG format with 70% quality level and a 300 dpi resolution.
print -djpeg70 -r300 srtmimage
The new fi le srtmimage.jpg has a size of 300 KB. The decompressed image
has a size of 16.5 MB. This file can now be imported to another software
package such as Adobe Photoshop.
7.6 Gridding and Contouring Background
The previous data sets were all stored in equally-spaced two-dimensional
arrays. Most data in earth sciences, however, are obtained on an irregular
sampling pattern. Therefore, irregular-spaced data have to be interpolated,
SRTM Data Set
0
ï0.1
ï0.2
ï0.3
ï0.4
Latitude ï0.5
ï0.6
ï0.7
ï0.8
ï0.9
ï1
36 36.1 36.2 36.3 36.4 36.5 36.6 36.7 36.8 36.9 37
Longitude
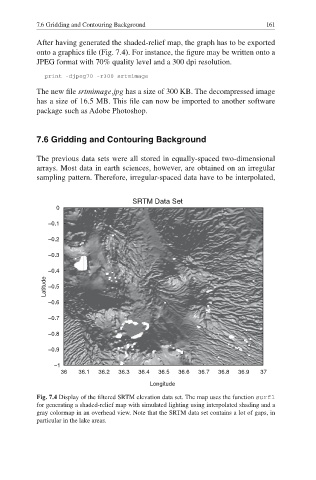
Fig. 7.4 Display of the filtered SRTM elevation data set. The map uses the function surfl
for generating a shaded-relief map with simulated lighting using interpolated shading and a
gray colormap in an overhead view. Note that the SRTM data set contains a lot of gaps, in
particular in the lake areas.