
Page 184 - MATLAB Recipes for Earth Sciences
P. 184
7.9 Geostatistics (by R. Gebbers) 179
plot(D(I),G(I),'.' )
xlabel('lag distance')
ylabel('variogram')
The variogram cloud gives you an impression of the dispersion of values at
the different lags. It might be useful to detect outliers or anomalies, but it
is hard to judge from it whether there is any spatial correlation, what form
it might have, and how we could model it (Webster and Oliver, 2001). To
obtain a clearer view and to prepare variogram modeling the experimental
variogram is replaced by the variogram estimator in the next section.
The variogram estimator is derived from the experimental variograms to
summarize their central tendency (similar to the descriptive statistics derived
from univariate observations, Chapter 3.2). The classical variogram estima-
tor is the averaged empirical variogram within certain distance classes or
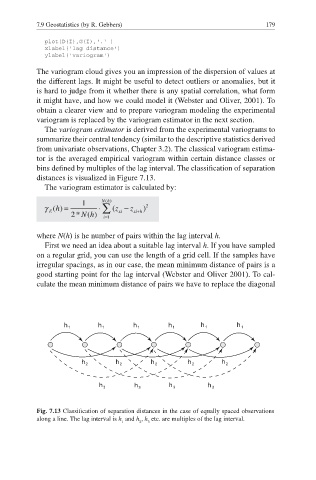
bins defined by multiples of the lag interval. The classification of separation
distances is visualized in Figure 7.13.
The variogram estimator is calculated by:
where N(h) is he number of pairs within the lag interval h.
First we need an idea about a suitable lag interval h. If you have sampled
on a regular grid, you can use the length of a grid cell. If the samples have
irregular spacings, as in our case, the mean minimum distance of pairs is a
good starting point for the lag interval (Webster and Oliver 2001). To cal-
culate the mean minimum distance of pairs we have to replace the diagonal
h 1 h 1 h 1 h 1 h 1 h 1
h 2 h 2 h 2 h 2 h 2
h 3 h 3 h 3 h 3
Fig. 7.13 Classification of separation distances in the case of equally spaced observations
along a line. The lag interval is h and h , h etc. are multiples of the lag interval.
1 2 3