
Page 186 - MATLAB Recipes for Earth Sciences
P. 186
7.9 Geostatistics (by R. Gebbers) 181
yl = 1.1*max(GE);
ylim([0 yl])
xlabel('lag distance')
ylabel('variogram')
hold off
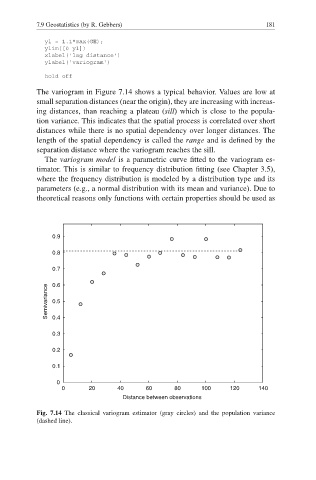
The variogram in Figure 7.14 shows a typical behavior. Values are low at
small separation distances (near the origin), they are increasing with increas-
ing distances, than reaching a plateau ( sill) which is close to the popula-
tion variance. This indicates that the spatial process is correlated over short
distances while there is no spatial dependency over longer distances. The
length of the spatial dependency is called the range and is defined by the
separation distance where the variogram reaches the sill.
The variogram model is a parametric curve fitted to the variogram es-
timator. This is similar to frequency distribution fitting (see Chapter 3.5),
where the frequency distribution is modeled by a distribution type and its
parameters (e.g., a normal distribution with its mean and variance). Due to
theoretical reasons only functions with certain properties should be used as
0.9
0.8
0.7
0.6
Semivariance 0.5
0.4
0.3
0.2
0.1
0
0 20 40 60 80 100 120 140
Distance between observations
Fig. 7.14 The classical variogram estimator (gray circles) and the population variance
(dashed line).