
Page 219 - MATLAB Recipes for Earth Sciences
P. 219
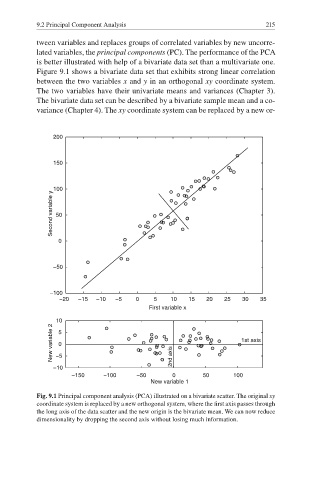
9.2 Principal Component Analysis                                215

           tween variables and replaces groups of correlated variables by new uncorre-
           lated variables, the principal components (PC). The performance of the PCA
           is better illustrated with help of a bivariate data set than a multivariate one.
           Figure 9.1 shows a bivariate data set that exhibits strong linear correlation
           between the two variables x and y in an orthogonal xy coordinate system.
           The two variables have their univariate means and variances (Chapter 3).
           The bivariate data set can be described by a bivariate sample mean and a co-
           variance (Chapter 4). The xy coordinate system can be replaced by a new or-


                200


                150


                Second variable y 100


                 50


                 0


                −50


               −100
                  −20  −15  −10  −5    0    5   10   15   20   25   30   35
                                          First variable x
                New variable 2 10                                   1st axis
                 5
                 0
                 −5
                −10                              2nd axis
                     −150     −100     −50       0       50       100
                                           New variable 1
           Fig. 9.1 Principal component analysis (PCA) illustrated on a bivariate scatter. The original xy

           coordinate system is replaced by a new orthogonal system, where the first axis passes through
           the long axis of the data scatter and the new origin is the bivariate mean. We can now reduce
           dimensionality by dropping the second axis without losing much information.