
Page 221 - MATLAB Recipes for Earth Sciences
P. 221
9.2 Principal Component Analysis 217
percentage of various minerals contained in sediment samples. The sediments
are sourced from three rock types: a magmatic rock containins amphibole
(amp), pyroxene (pyr) and plagioclase (pla), a hydrothermal vein character-
ized by the occurrence of fl uorite (fl u), sphalerite (sph) and galenite (gal), as
well as some feldspars (plagioclase and potassium feldspar, ksp) and quartz,
and a sandstone unit containing feldspars, quartz and clay minerals (cla).
Ten samples were taken from various levels of this sedimentary sequence
that are comprised of varying amounts of these minerals. The PCA is used to
verify the influence of the three different source rocks and to estimate their
relative contribution. Firstly, the data are loaded by typing
data = load('sediments.txt');
Next we define labels for the various graphs created by the PCA. We number
the samples 1 to 10, whereas the minerals are characterized by three-char-
acter abbreviations.
for i=1:10
sample(i,:) = ['sample',sprintf('%02.0f',i)];
end
clear i
minerals= ['amp';'pyr';'pla';'ksp';'qtz';'cla';'flu';'sph';'gal'];
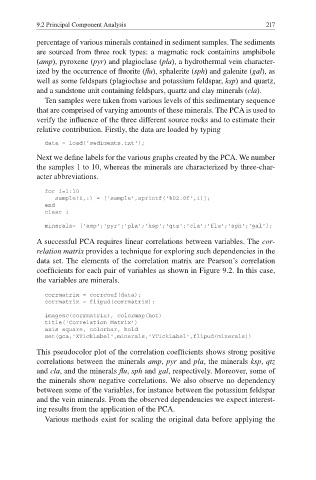
A successful PCA requires linear correlations between variables. The cor-
relation matrix provides a technique for exploring such dependencies in the
data set. The elements of the correlation matrix are Pearson·s correlation
coefficients for each pair of variables as shown in Figure 9.2. In this case,
the variables are minerals.
corrmatrix = corrcoef(data);
corrmatrix = flipud(corrmatrix);
imagesc(corrmatrix), colormap(hot)
title('Correlation Matrix')
axis square, colorbar, hold
set(gca,'XTickLabel',minerals,'YTickLabel',flipud(minerals))
This pseudocolor plot of the correlation coefficients shows strong positive
correlations between the minerals amp, pyr and pla, the minerals ksp, qtz
and cla, and the minerals fl u, sph and gal, respectively. Moreover, some of
the minerals show negative correlations. We also observe no dependency
between some of the variables, for instance between the potassium feldspar
and the vein minerals. From the observed dependencies we expect interest-
ing results from the application of the PCA.
Various methods exist for scaling the original data before applying the