
Page 229 - MATLAB Recipes for Earth Sciences
P. 229
9.4 Independent Component Analysis (by N. Marwan) 225
0.22
0.20
0.18
Distance 0.16
0.14
0.12
0.10
0.08
0.06
2 9 1 8 10 3 4 5 6 7
Sample No.
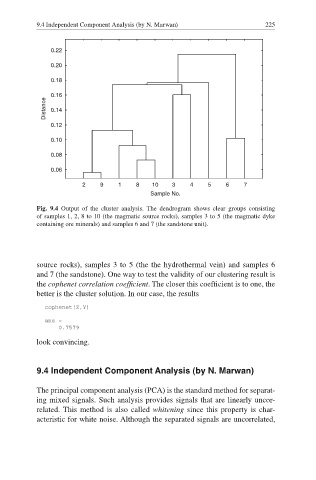
Fig. 9.4 Output of the cluster analysis. The dendrogram shows clear groups consisting
of samples 1, 2, 8 to 10 (the magmatic source rocks), samples 3 to 5 (the magmatic dyke
containing ore minerals) and samples 6 and 7 (the sandstone unit).
source rocks), samples 3 to 5 (the the hydrothermal vein) and samples 6
and 7 (the sandstone). One way to test the validity of our clustering result is
the cophenet correlation coefficient. The closer this coefficient is to one, the
better is the cluster solution. In our case, the results
cophenet(Z,Y)
ans =
0.7579
look convincing.
9.4 Independent Component Analysis (by N. Marwan)
The principal component analysis (PCA) is the standard method for separat-
ing mixed signals. Such analysis provides signals that are linearly uncor-
related. This method is also called whitening since this property is char-
acteristic for white noise. Although the separated signals are uncorrelated,