
Page 85 - MATLAB Recipes for Earth Sciences
P. 85
4.8 Cross Validation 77
does not display the distribution of the coefficients as clearly as the boot-
strap estimates (Fig. 4.7). We have seen that resampling using the jackknife
or bootstrap methods provides a simple and valuable tool to test the quality
of regression models. The next chapter introduces an alternative approach
for quality estimation, which is by far more often used than resampling.
4.8 Cross Validation
A third method to test the goodness-of-fit of the regression is cross valida-
tion. The regression line is computed by using n-1 data points. The n-th data
point is predicted and the discrepancy between the prediction and the actual
value is computed. Subsequently, the mean of the discrepancies between the
actual and predicted values is determined.
In this example, the cross validation for n data points is computed. The
corresponding 30 regression lines display some dispersion in slope and y-
axis intercept.
for i = 1 : 30
% Define temporary variables j_meters and j_age
j_meters = meters;
j_age = age;
% Eliminate the i-th data point
1st Regression Coefficient 2st Regression Coefficient
12 10
Slope Y Intercept
10 = 5.6±0.4 = 1.3±4.4
Jackknife Samples 8 Jackknife Samples 8 6 4
6
4
2 2
0 0
5.4 5.5 5.6 5.7 5.8 5.9 −2 −1 0 1 2 3
Slope Y−Axis Intercept
a b
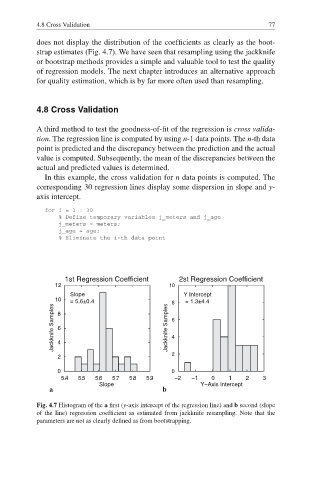
Fig. 4.7 Histogram of the a fi rst (y-axis intercept of the regression line) and b second (slope
of the line) regression coefficient as estimated from jackknife resampling. Note that the
parameters are not as clearly defined as from bootstrapping.