
Page 82 - MATLAB Recipes for Earth Sciences
P. 82
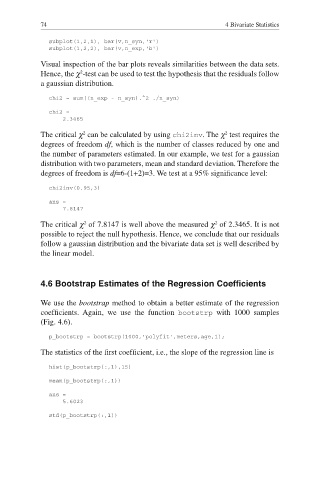
74                                                  4 Bivariate Statistics

               subplot(1,2,1), bar(v,n_syn,'r')
               subplot(1,2,2), bar(v,n_exp,'b')

            Visual inspection of the bar plots reveals similarities between the data sets.
            Hence, the χ -test can be used to test the hypothesis that the residuals follow
                       2
            a gaussian distribution.

               chi2 = sum((n_exp - n_syn).^2 ./n_syn)
               chi2 =
                   2.3465

                        2
                                                                2
            The critical χ  can be calculated by using chi2inv. The χ  test requires the
            degrees of freedom df, which is the number of classes reduced by one and
            the number of parameters estimated. In our example, we test for a gaussian
            distribution with two parameters, mean and standard deviation. Therefore the
            degrees of freedom is df=6-(1+2)=3. We test at a 95% signifi cance level:
               chi2inv(0.95,3)

               ans =
                   7.8147
            The critical χ  of 7.8147 is well above the measured χ  of 2.3465. It is not
                        2
                                                             2
            possible to reject the null hypothesis. Hence, we conclude that our residuals
            follow a gaussian distribution and the bivariate data set is well described by
            the linear model.


            4.6 Bootstrap Estimates of the Regression Coeffi cients

            We use the  bootstrap method to obtain a better estimate of the regression
            coefficients.  Again, we use the function  bootstrp with 1000 samples

            (Fig. 4.6).
               p_bootstrp = bootstrp(1000,'polyfit',meters,age,1);
            The statistics of the fi rst coefficient, i.e., the slope of the regression line is

               hist(p_bootstrp(:,1),15)

               mean(p_bootstrp(:,1))
               ans =
                   5.6023

               std(p_bootstrp(:,1))