
Page 93 - MATLAB Recipes for Earth Sciences
P. 93
86 5 Time-Series Analysis
Atlantic SST Variability
Power Spectral Density 40 ENSO 1.2 Cycle
13.1
30
3.2
Annual
20
1.0
2.2
10
0 1.8
0 0.5 1 1.5 2
Frequency (yrs -1 )
a b
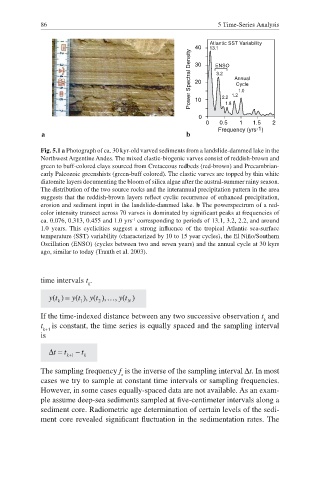
Fig. 5.1 a Photograph of ca. 30 kyr-old varved sediments from a landslide-dammed lake in the
Northwest Argentine Andes. The mixed clastic-biogenic varves consist of reddish-brown and
green to buff-colored clays sourced from Cretaceous redbeds (red-brown) and Precambrian-
early Paleozoic greenshists (green-buff colored). The clastic varves are topped by thin white
diatomite layers documenting the bloom of silica algae after the austral-summer rainy season.
The distribution of the two source rocks and the interannual precipitation pattern in the area
suggests that the reddish-brown layers reflect cyclic recurrence of enhanced precipitation,
erosion and sediment input in the landslide-dammed lake. b The powerspectrum of a red-
color intensity transect across 70 varves is dominated by signifi cant peaks at frequencies of
-1
ca. 0.076, 0.313, 0.455 and 1.0 yrs corresponding to periods of 13.1, 3.2, 2.2, and around
1.0 years. This cyclicities suggest a strong influence of the tropical Atlantic sea-surface
temperature (SST) variability (characterized by 10 to 15 year cycles), the El Niño/Southern
Oscillation (ENSO) (cycles between two and seven years) and the annual cycle at 30 kyrs
ago, similar to today (Trauth et al. 2003).
time intervals t .
k
If the time-indexed distance between any two successive observation t and
k
t is constant, the time series is equally spaced and the sampling interval
k+1
is
The sampling frequency f is the inverse of the sampling interval ¨t. In most
s
cases we try to sample at constant time intervals or sampling frequencies.
However, in some cases equally-spaced data are not available. As an exam-
ple assume deep-sea sediments sampled at five-centimeter intervals along a
sediment core. Radiometric age determination of certain levels of the sedi-
ment core revealed signifi cant fluctuation in the sedimentation rates. The