
Page 97 - MATLAB Recipes for Earth Sciences
P. 97
90 5 Time-Series Analysis
Composite Periodic Signal
4
3
2
1
y(t) 0
−1
−2
−3
−4
0 20 40 60 80 100 120 140 160 180 200
t
a
Signal with Additive Random Noise
4
Signal with
3
noise
2
1
y(t) 0
−1
−2
Original
−3 signal
−4
0 20 40 60 80 100 120 140 160 180 200
t
b
Signal with Linear Trend
4
Signal with
3
trend
2
1
y(t) 0
−1
−2
Original
−3
signal
−4
0 20 40 60 80 100 120 140 160 180 200
t
c
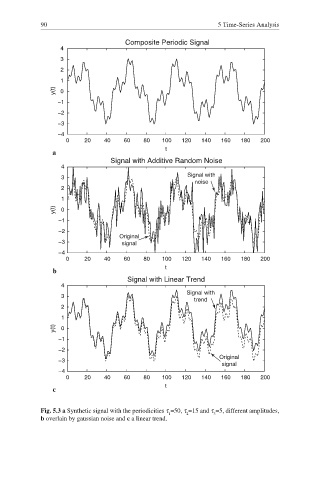
Fig. 5.3 a Synthetic signal with the periodicities τ =50, τ =15 and τ =5, different amplitudes,
1 2 3
b overlain by gaussian noise and c a linear trend.