
Page 101 - MATLAB Recipes for Earth Sciences
P. 101
94 5 Time-Series Analysis
Principle of Welchʼs Method
2
1
y(t) 0
−1
−2
Original signal
1st segment
2 (t = 1 : 100)
1 Overlap of 100 samples
y(t) 0
−1
2nd segment
−2 (t = 51 : 150)
2
1
0 y(t)
−1
−2
2
1
y(t) 0 Overlap of 100 samples
−1
−2 3rd segment
(t = 101 : 200)
0 20 40 60 80 100 120 140 160 180 200
e t
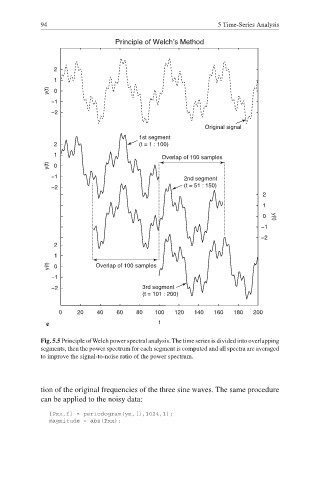
Fig. 5.5 Principle of Welch power spectral analysis. The time series is divided into overlapping
segments, then the power spectrum for each segment is computed and all spectra are averaged
to improve the signal-to-noise ratio of the power spectrum.
tion of the original frequencies of the three sine waves. The same procedure
can be applied to the noisy data:
[Pxx,f] = periodogram(yn,[],1024,1);
magnitude = abs(Pxx);