
Page 106 - MATLAB Recipes for Earth Sciences
P. 106
5.4 Crossspectral Analysis 99
shift of t=1. In the argument of the second sine wave this corresponds to
2/5, which is one fifth of the full wavelength of τ=5.
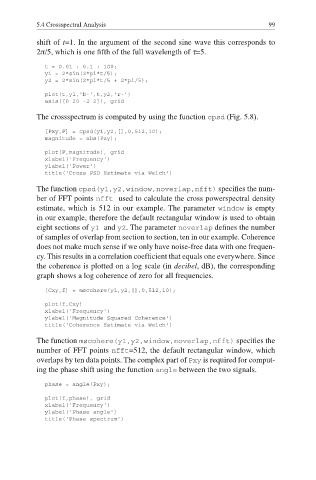
t = 0.01 : 0.1 : 100;
y1 = 2*sin(2*pi*t/5);
y2 = 2*sin(2*pi*t/5 + 2*pi/5);
plot(t,y1,'b-',t,y2,'r-')
axis([0 20 -2 2]), grid
The crossspectrum is computed by using the function cpsd (Fig. 5.8).
[Pxy,F] = cpsd(y1,y2,[],0,512,10);
magnitude = abs(Pxy);
plot(F,magnitude), grid
xlabel('Frequency')
ylabel('Power')
title('Cross PSD Estimate via Welch')
The function cpsd(y1,y2,window,noverlap,nfft) specifies the num-
ber of FFT points nfft used to calculate the cross powerspectral density
estimate, which is 512 in our example. The parameter window is empty
in our example, therefore the default rectangular window is used to obtain
eight sections of y1 and y2. The parameter noverlap defi nes the number
of samples of overlap from section to section, ten in our example. Coherence
does not make much sense if we only have noise-free data with one frequen-
cy. This results in a correlation coefficient that equals one everywhere. Since
the coherence is plotted on a log scale (in decibel, dB), the corresponding
graph shows a log coherence of zero for all frequencies.
[Cxy,f] = mscohere(y1,y2,[],0,512,10);
plot(f,Cxy)
xlabel('Frequency')
ylabel('Magnitude Squared Coherence')
title('Coherence Estimate via Welch')
The function mscohere(y1,y2,window,noverlap,nfft) specifi es the
number of FFT points nfft=512, the default rectangular window, which
overlaps by ten data points. The complex part of Pxy is required for comput-
ing the phase shift using the function angle between the two signals.
phase = angle(Pxy);
plot(f,phase), grid
xlabel('Frequency')
ylabel('Phase angle')
title('Phase spectrum')