
Page 105 - MATLAB Recipes for Earth Sciences
P. 105
98 5 Time-Series Analysis
the complex Fourier transform X(f) also contains information on the phase
relationship W(f) of the two signals:
The phase difference is important in calculating leads and lags between two
signals, a parameter often used to propose causalities between the two pro-
cesses documented by the signals. The correlation between the two spectra
can be calculated by means of the coherence:
The coherence is a real number between 0 and 1, where 0 indicates no cor-
relation and 1 indicates maximum correlation between x(t) and y(t) at the
frequency f. Significant degree of coherence is an important precondition for
computing phase shifts between the two signals.
We use two sine waves with identical periodicities τ=5 (equivalent to
f=0.2) and amplitudes equal to two. The sine waves show a relative phase
Cross PSD Estimate Phase spectrum
20 4
f 1 =0.02 3 f 1 =0.02
15 2
Power 10 Phase angle 1
Corresponding phase
0
angle of 1.2568, equals
5 (1.2568*5)/(2*π)=1.001
−1
0 −2
0 1 2 3 4 5 0 1 2 3 4 5
Frequency Frequency
a b
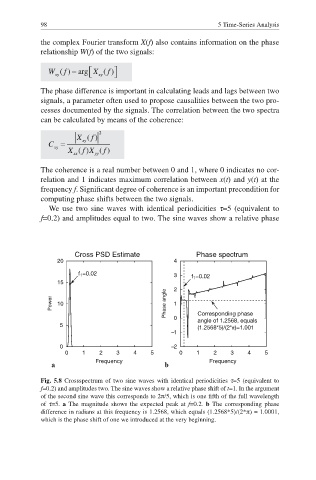
Fig. 5.8 Crossspectrum of two sine waves with identical periodicities τ=5 (equivalent to
f=0.2) and amplitudes two. The sine waves show a relative phase shift of t=1. In the argument
of the second sine wave this corresponds to 2/5, which is one fifth of the full wavelength
of τ=5. a The magnitude shows the expected peak at f=0.2. b The corresponding phase
difference in radians at this frequency is 1.2568, which equals (1.2568*5)/(2*) = 1.0001,
which is the phase shift of one we introduced at the very beginning.