Page 95 - MATLAB Recipes for Earth Sciences
P. 95

88                                                5 Time-Series Analysis

                                         Periodic Signal
                  3
                  2

                  1               Amplitude A
                y(t)  0

                  −1
                  −2
                                                      Period τ
                  −3
                    0    1     2    3     4    5     6    7     8    9    10
                                               t
                                         Periodic Signals
                  3
                                         y 1 (t)
                  2
                                   y 2 (t)
                  1
                y(t)  0
                  −1

                  −2
                                          Phase Shift ∆t
                  −3
                    0    1     2    3     4    5     6    7     8    9    10
                                               t

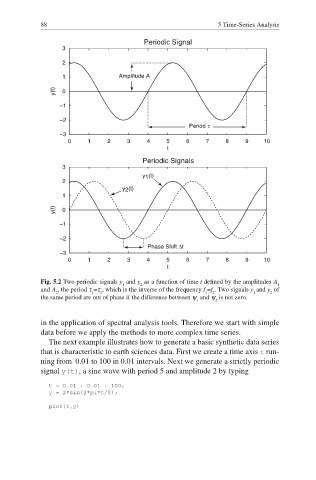
            Fig. 5.2 Two periodic signals y  and y  as a function of time t defined by the amplitudes A
                                   1    2                                     1
            and A , the period τ =τ , which is the inverse of the frequency f =f . Two signals y and y  of
                 2         1  2                           1  2         1    2
            the same period are out of phase if the difference between ψ  and ψ  is not zero.
                                                        1    2
            in the application of spectral analysis tools. Therefore we start with simple
            data before we apply the methods to more complex time series.
               The next example illustrates how to generate a basic synthetic data series
            that is characteristic to earth sciences data. First we create a time axis t run-
            ning from  0.01 to 100 in 0.01 intervals. Next we generate a strictly periodic
            signal y(t), a sine wave with period 5 and amplitude 2 by typing
               t = 0.01 : 0.01 : 100;
               y = 2*sin(2*pi*t/5);
               plot(t,y)
   90   91   92   93   94   95   96   97   98   99   100