Page 497 - Marine Structural Design
P. 497
Chapter 26 Reliability-Based Design and Code Calibration              473


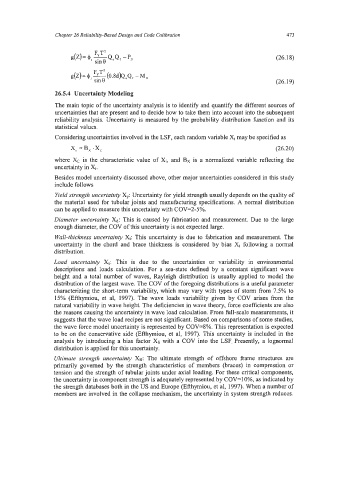
                                                                                     (26.18)


                                                                                     (26.19)
                  26.5.4  Uncertainty Modeling
                  The main topic of the uncertainty analysis is to identify and quantify the different sources of
                  uncertainties that are present and to decide how to take them into account into the subsequent
                  reliability analysis. Uncertainty is measured by the probability distribution function and its
                  statistical values.
                  Considering uncertainties involved in the LSF, each random variable Xi may be specified as
                       Xi = B,  OX,                                                  (26.20)

                  where XC is the characteristic value of Xi,  and  Bx  is a normalized  variable reflecting the
                  uncertainty in Xi.
                  Besides model uncertainty discussed above, other major uncertainties considered in this study
                  include follows
                  Yield strength uncertainty X,:  Uncertainty for yield strength usually depends on the quality of
                  the material used  for tubular joints and manufacturing specifications. A normal distribution
                 can be applied to measure this uncertainty with COV=2-5%.
                 Diameter  uncertainty Xd:  This is caused by fabrication and measurement. Due to the large
                 enough diameter, the COV of this uncertainty is not expected large.
                  Wall-thickness uncertainty Xt: This uncertainty is due to fabrication and measurement. The
                 uncertainty in  the chord and  brace  thickness is considered by bias X,  following a normal
                 distribution.
                 Load  uncertainty  X,:  This  is  due  to  the  uncertainties  or  variability  in  environmental
                 descriptions and  loads  calculation. For  a  sea-state defined  by  a  constant significant wave
                 height and  a total number of waves,  Rayleigh distribution is usually applied to model the
                 distribution of the largest wave. The COV of the foregoing distributions is a useful parameter
                 characterizing the short-term variability, which may vary with types of storm from 7.5% to
                  15% (Efthymiou, et  al,  1997). The wave  loads variability given by  COV  arises  from  the
                 natural variability in wave height. The deficiencies in wave theory, force coefficients are also
                 the reasons causing the uncertainty in wave load calculation. From full-scale measurements, it
                 suggests that the wave load recipes are not significant. Based on comparisons of some studies,
                 the wave force model uncertainty is represented by COV=8%. This representation is expected
                 to be on the conservative side (Eflhymiou, et al,  1997). This uncertainty is included in the
                 analysis by  introducing a bias  factor XS with  a COV  into the LSF. Presently, a lognormal
                 distribution is applied for this uncertainty.
                 Ultimate  strength  uncertainty  XR: The  ultimate  strength of  offshore  frame  structures are
                 primarily governed  by  the  strength characteristics of  members  (braces) in  compression or
                 tension and the strength of tubular joints under axial loading. For these critical components,
                 the uncertainty in component strength is adequately represented by COV=lO%, as indicated by
                 the strength databases both in the US and Europe (Efthymiou, et al, 1997). When a number of
                 members are involved in the collapse mechanism, the uncertainty in system strength reduces.

