
Page 501 - Marine Structural Design
P. 501
Chapter 26 Reliability-Based Design and Code Calibration 477
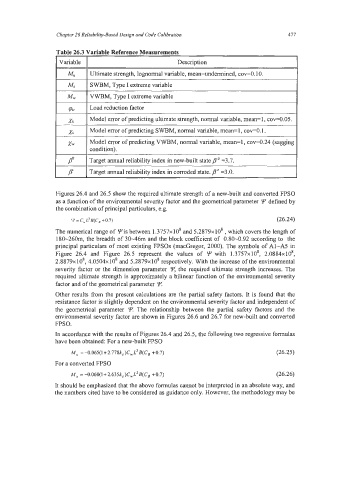
Table 26.3 Variable Reference Measurements
I Variable I] Description I
I Mu I] Ultimate strength, lognormal variable, mean-ndermined, ~0~0.10. I
I Ms I SWBM, Type I extreme variable I
I M, I VWBM, Type I extreme variable I
I p,,, I] reduction factor I
I xu 1 Model error of predicting ultimate strength, normal variable, mean=l, cov=0.05. I
I xs I] Model error of predicting SWBM, normal variable, mean=l , cov=O. 1. I
~~ ~ ~ ~~
xw Model error of predicting VWBM, normal variable, mean=I, ~0~0.24 (sagging
condition).
p” Target annual reliability index in new-built state Bo =3.7.
I p” 11 Target annual reliability index in corroded state. p‘ =3.0. I
Figures 26.4 and 26.5 show the required ultimate strength of a new-built and converted FPSO
as a function of the environmental severity factor and the geometrical parameter Y defined by
the combination of principal particulars, e.g.
Y=C,LZB(C, c0.7) (26.24)
The numerical range of Yis between 1.3757~10’ and 5.2879~10~ , which covers the length of
180-260m, the breadth of 30-46m and the block coefficient of 0.80-0.92 according to the
principal particulars of most existing FPSOs (macGregor, 2000). The symbols of A1-A5 in
Figure 26.4 and Figure 26.5 represent the values of Y with 1.3757x10⁸, 2.O884x1O8,
2.8879~ lo8, 4.0504~ 10’ and 5.2879~ lo8 respectively. With the increase of the environmental
severity factor or the dimension parameter the required ultimate strength increases. The
required ultimate strength is approximately a bilinear function of the environmental severity
factor and of the geometrical parameter !F
Other results from the present calculations are the partial safety factors. It is found that the
resistance factor is slightly dependent on the environmental severity factor and independent of
the geometrical parameter Y The relationship between the partial safety factors and the
environmental severity factor are shown in Figures 26.6 and 26.7 for new-built and converted
FPSO.
In accordance with the results of Figures 26.4 and 26.5, the following two regressive formulas
have been obtained: For a new-built FPSO
M, = -0.065(1+2.778k,)C,LZB(CB +0.7) (26.25)
For a converted FPSO
M, = -0.060(1 +2.635k,)C,L2B(CB +0.7) (26.26)
It should be emphasized that the above formulas cannot be interpreted in an absolute way, and
the numbers cited have to be considered as guidance only. However, the methodology may be