
Page 159 - Marks Calculation for Machine Design
P. 159
P1: Rakesh
January 4, 2005
14:16
Brown.cls
Brown˙C03
ADVANCED LOADINGS
Substitute either (σ x ) or (σ y ) from Eq. (3.25) and (σ z ) from Eq. (3.26) in Eq. (3.24) to
give the maximum shear stress (τ max ) at the plane of contact as 141
" #
1
− p max 2 + ν − [− p max ]
σ x − σ z σ y − σ z
τ max = = =
2 2 2
" #
1 1
−p max + ν + p max p max 1 − − ν
2 2
= = (3.27)
2 2
1
p max − ν
2 1 ν
= = p max −
2 4 2
Even though the principal stresses are a maximum at the plane of contact (z = 0),it
turns out that the maximum value of the maximum shear stress (τ max ) does not occur at
(z = 0) but at some small distance into the sphere. Typically this small distance is between
zero and half the radius of the contact area (a/2). This explains what is seen in practice
where a spherical ball bearing develops a crack internally, then as the crack propagates to
the surface of the ball it eventually allows lubricant in the bearing to enter the crack and
fracture the ball bearing catastrophically by hydrostatic pressure.
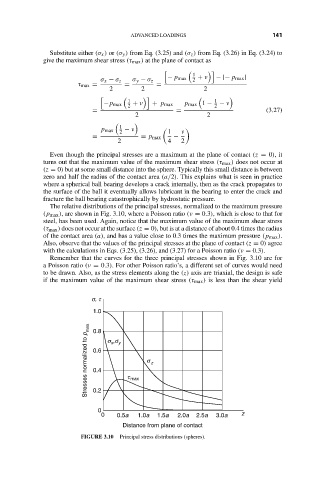
The relative distributions of the principal stresses, normalized to the maximum pressure
(p max ), are shown in Fig. 3.10, where a Poisson ratio (ν = 0.3), which is close to that for
steel, has been used. Again, notice that the maximum value of the maximum shear stress
(τ max ) does not occur at the surface (z = 0), but is at a distance of about 0.4 times the radius
of the contact area (a), and has a value close to 0.3 times the maximum pressure (p max ).
Also, observe that the values of the principal stresses at the plane of contact (z = 0) agree
with the calculations in Eqs. (3.25), (3.26), and (3.27) for a Poisson ratio (ν = 0.3).
Remember that the curves for the three principal stresses shown in Fig. 3.10 are for
a Poisson ratio (ν = 0.3). For other Poisson ratio’s, a different set of curves would need
to be drawn. Also, as the stress elements along the (z) axis are triaxial, the design is safe
if the maximum value of the maximum shear stress (τ max ) is less than the shear yield
s, t
1.0
Stresses normalized to p max 0.6 s x ,s y t max s z
0.8
0.4
0.2
0
0 0.5a 1.0a 1.5a 2.0a 2.5a 3.0a z
Distance from plane of contact
FIGURE 3.10 Principal stress distributions (spheres).