
Page 325 - Marks Calculation for Machine Design
P. 325
P1: Shashi
January 4, 2005
15:4
Brown˙C07
Brown.cls
FATIGUE AND DYNAMIC DESIGN
Step 10. Calculate the polar moment of inertia (J) of the circular cross section as
1 4 1 4 4 307
J = π R = π(0.75 in) = 0.497 in
2 2
Step 11. Calculate the mean shear stress (τ m ) and the alternating shear stress (τ a ) as
T m R (24,000 in · lb)(0.75 in)
τ m = = = 36.2 kpsi
J 0.497 in 4
T a R (2,400 in · lb)(0.75 in)
τ a = = = 3.6 kpsi
J 0.497 in 4
Step 12. Using the given ultimate tensile stress (S ut ) and Eq. (7.33), calculate the ultimate
shear strength (S us ) as
S us = 0.67 S ut = (0.67)(90 kpsi) = 60.3 kpsi
Step 13. Calculate the factor-of-safety (n) using Eq. (7.34), which represents the dis-
tance (d) in Fig. 7.24, as
1 τ a τ m 3.6 kpsi 36.2 kpsi
= + = + = (0.581) + (0.600) = 1.181
n S e S us 6.2 kpsi 60.3 kpsi
1
n = = 0.85 (unsafe!)
1.181
which means the design is unsafe because the factor-of-safety n is less than 1.
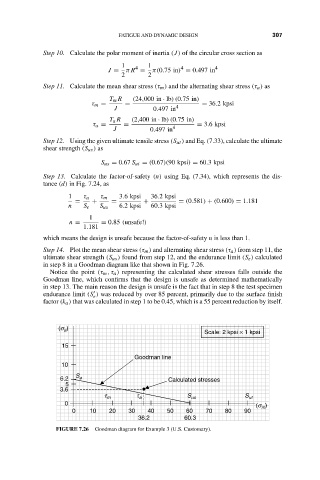
Step 14. Plot the mean shear stress (τ m ) and alternating shear stress (τ a ) from step 11, the
ultimate shear strength (S us ) found from step 12, and the endurance limit (S e ) calculated
in step 8 in a Goodman diagram like that shown in Fig. 7.26.
Notice the point (τ m ,τ a ) representing the calculated shear stresses falls outside the
Goodman line, which confirms that the design is unsafe as determined mathematically
in step 13. The main reason the design is unsafe is the fact that in step 8 the test specimen
endurance limit (S ) was reduced by over 85 percent, primarily due to the surface finish
e
factor (k a ) that was calculated in step 1 to be 0.45, which is a 55 percent reduction by itself.
(s )
a
Scale: 2 kpsi × 1 kpsi
15
Goodman line
10
S
6.2 e Calculated stresses
5
3.6
t S S
t m a us ut
0 (s )
m
0 10 20 30 40 50 60 70 80 90
36.2 60.3
FIGURE 7.26 Goodman diagram for Example 3 (U.S. Customary).